GameStop 2008 Annual Report Download - page 49
Download and view the complete annual report
Please find page 49 of the 2008 GameStop annual report below. You can navigate through the pages in the report by either clicking on the pages listed below, or by using the keyword search tool below to find specific information within the annual report.-
 1
1 -
2
-
3
-
4
-
5
-
6
-
7
-
8
-
9
-
10
-
11
-
12
-
13
-
14
-
15
-
16
-
17
-
18
-
19
-
20
-
21
-
22
-
23
-
24
-
25
-
26
-
27
-
28
-
29
-
30
-
31
-
32
-
33
-
34
-
35
-
36
-
37
-
38
-
 39
39 -
 40
40 -
 41
41 -
 42
42 -
 43
43 -
 44
44 -
 45
45 -
 46
46 -
 47
47 -
 48
48 -
 49
49 -
 50
50 -
 51
51 -
 52
52 -
 53
53 -
 54
54 -
 55
55 -
 56
56 -
 57
57 -
 58
58 -
 59
59 -
60
-
61
-
62
-
63
-
64
-
65
-
66
-
67
-
68
-
69
-
70
-
71
-
72
-
73
-
74
-
75
-
76
-
77
-
78
-
79
-
80
-
81
-
82
-
83
-
84
-
85
-
86
-
87
-
88
-
89
-
90
-
91
-
92
-
93
-
94
-
95
-
96
-
97
-
98
-
99
-
100
-
101
-
102
-
103
-
104
-
105
-
106
-
107
-
108
-
109
-
110
-
111
-
112
-
113
-
114
 |
 |
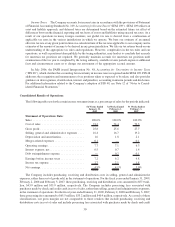
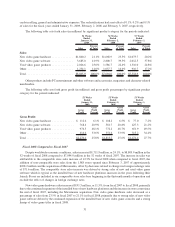
in the other product categories. Gross profit as a percentage of sales was also impacted by a decrease in the excess of
vendor allowances received over marketing and advertising expenses. Vendor allowances received during fiscal
2006 were abnormally high due to the launches of the Nintendo Wii and the Sony PlayStation 3 and returned to
normal levels in fiscal 2007. In addition, net vendor allowances decreased due to higher expenditures on marketing
and advertising from fiscal 2006 to fiscal 2007 in support of the Company’s branding campaign. These factors led to
a decrease in gross profit as a percentage of sales on new video game hardware, new video game software and other
products from 7.2%, 21.2% and 34.4% of sales, respectively, in fiscal 2006 to 6.5%, 20.8% and 33.9% of sales,
respectively, in fiscal 2007. Gross profit as a percentage of sales on used video game products decreased from 49.5%
in fiscal 2006 to 48.7% in fiscal 2007 due to increased promotional expenses and higher refurbishment costs
associated with an increase in production of refurbished hardware platforms during fiscal 2007.
Selling, general and administrative expenses increased by $160.9 million, or 15.8%, from $1,021.1 million in
fiscal 2006 to $1,182.0 million in fiscal 2007. The increase was primarily attributable to the increase in the number
of stores in operation, and the related increases in store, distribution and corporate office operating expenses, offset
by expenses from the 53rd week included in fiscal 2006. Selling, general and administrative expenses as a
percentage of sales decreased from 19.2% in fiscal 2006 to 16.7% in fiscal 2007. The decrease in selling, general
and administrative expenses as a percentage of sales was primarily due to leveraging as a result of the higher sales
associated with the introduction of the new video game systems and synergies associated with the acquisition of EB.
Selling, general and administrative expenses include $26.9 million and $21.0 million in stock-based compensation
expense for fiscal 2007 and fiscal 2006, respectively. Foreign currency transaction gains and (losses) are included in
selling, general and administrative expenses and amounted to $8.6 million in fiscal 2007, compared to ($1.0) million
in fiscal 2006.
Depreciation and amortization expense increased from $109.9 million in fiscal 2006 to $130.3 million in fiscal
2007. This increase of $20.4 million was due primarily to capital expenditures for 586 new GameStop stores.
Interest income resulting from the investment of excess cash balances increased from $11.3 million in fiscal
2006 to $13.8 million in fiscal 2007 due to interest earned on invested assets. Interest expense decreased from
$84.7 million in fiscal 2006 to $61.6 million in fiscal 2007, primarily due to the retirement of $20.0 million of the
Company’s senior notes and $250.0 million of the Company’s senior floating rate notes since February 3, 2007.
Debt extinguishment expense of $12.6 million was recognized in fiscal 2007 as a result of the premiums paid related
to debt retirement and the recognition of deferred financing fees and unamortized original issue discount. Debt
extinguishment expense of $6.1 million was incurred in fiscal 2006 for the loss associated with the Company’s
repurchase of $50.0 million of its senior notes payable and $50.0 million of its senior floating rate notes payable.
Income tax expense increased by $56.8 million, from $96.0 million in fiscal 2006 to $152.8 million in fiscal
2007. The Company’s effective tax rate decreased from 37.8% in fiscal 2006 to 34.6% in fiscal 2007 due to the
release of foreign valuation allowances on net operating losses and the recognition of foreign tax credits not
previously benefited. See Note 12 of “Notes to Consolidated Financial Statements” for additional information
regarding income taxes.
The factors described above led to an increase in operating earnings of $167.7 million, or 50.3%, from
$333.7 million in fiscal 2006 to $501.4 million in fiscal 2007 and an increase in net earnings of $130.0 million, or
82.1%, from $158.3 million in fiscal 2006 to $288.3 million in fiscal 2007.
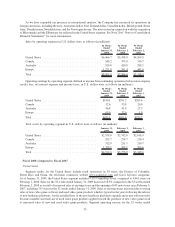
Segment Performance
The Company operates its business in the following segments: United States, Canada, Australia and Europe.
We identified these segments based on a combination of geographic areas, the methods with which we analyze
performance and how we divide management responsibility. Each of the segments consists primarily of retail
operations, with all stores engaged in the sale of new and used video game systems, software and accessories which
we refer to as video game products and PC entertainment software and related accessories. These products are
substantially the same regardless of geographic location, with the primary differences in merchandise carried being
the timing of the release of new products in the various segments. Stores in all segments are similar in size at an
average of approximately 1,500 square feet.
34