GameStop 2008 Annual Report Download - page 107
Download and view the complete annual report
Please find page 107 of the 2008 GameStop annual report below. You can navigate through the pages in the report by either clicking on the pages listed below, or by using the keyword search tool below to find specific information within the annual report.-
 1
1 -
2
-
3
-
4
-
5
-
6
-
7
-
8
-
9
-
10
-
11
-
12
-
13
-
14
-
15
-
16
-
17
-
18
-
19
-
20
-
21
-
22
-
23
-
24
-
25
-
26
-
27
-
28
-
29
-
30
-
31
-
32
-
33
-
34
-
35
-
36
-
37
-
38
-
39
-
40
-
41
-
42
-
43
-
44
-
45
-
46
-
47
-
48
-
49
-
50
-
51
-
52
-
53
-
54
-
55
-
56
-
57
-
58
-
59
-
60
-
61
-
62
-
63
-
64
-
65
-
66
-
67
-
68
-
69
-
70
-
71
-
72
-
73
-
74
-
75
-
76
-
77
-
78
-
79
-
80
-
81
-
82
-
83
-
84
-
85
-
86
-
87
-
88
-
89
-
90
-
91
-
92
-
93
-
94
-
95
-
96
-
 97
97 -
 98
98 -
 99
99 -
 100
100 -
 101
101 -
 102
102 -
 103
103 -
 104
104 -
 105
105 -
 106
106 -
 107
107 -
 108
108 -
 109
109 -
 110
110 -
 111
111 -
 112
112 -
 113
113 -
 114
114
 |
 |

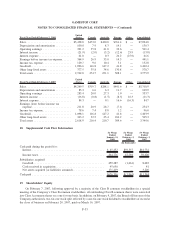
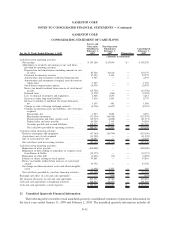
GAMESTOP CORP.
CONSOLIDATING STATEMENT OF CASH FLOWS
For the 52 Weeks Ended February 2, 2008
Issuers and
Guarantor
Subsidiaries
February 2,
2008
Non-Guarantor
Subsidiaries
February 2,
2008 Eliminations
Consolidated
February 2,
2008
(Amounts in thousands)
Cash flows from operating activities:
Net earnings .............................. $235,274 $ 53,017 $— $ 288,291
Adjustments to reconcile net earnings to net cash
flows provided by operating activities:
Depreciation and amortization (including amounts
in cost of sales) ........................ 100,961 30,316 — 131,277
Provision for inventory reserves .............. 44,728 7,151 — 51,879
Amortization and retirement of deferred financing
fees . . ............................... 5,669 — — 5,669
Amortization and retirement of original issue
discount on senior notes . . . ............... 1,162 — — 1,162
Stock-based compensation expense . . .......... 26,911 — — 26,911
Deferred taxes . .......................... (4,708) (6,291) — (10,999)
Excess tax benefits realized from exercise of stock-
based awards .......................... (93,322) — — (93,322)
Loss on disposal of property and equipment. . .... 1,960 6,245 — 8,205
Increase in other long-term liabilities. .......... 5,296 3,650 — 8,946
Increase in liability to landlords for tenant
allowances, net......................... 4,374 701 — 5,075
Change in the value of foreign exchange
contracts . . . .......................... 6,792 (6,606) — 186
Changes in operating assets and liabilities, net of
business acquired
Receivables, net . . . .................... (8,145) (11,758) — (19,903)
Merchandise inventories . . . ............... (51,452) (92,073) — (143,525)
Prepaid expenses and other current assets . . .... (6,265) 2,675 — (3,590)
Prepaid taxes and taxes payable. . . .......... 104,823 14,039 — 118,862
Accounts payable and accrued liabilities . . .... (39,710) 149,427 — 109,717
Net cash flows provided by operating
activities . .......................... 334,348 150,493 — 484,841
Cash flows from investing activities:
Purchase of property and equipment ............... (123,258) (52,311) — (175,569)
Acquisitions, net of cash acquired . ............... 1,061 — — 1,061
Net cash flows used in investing activities ......... (122,197) (52,311) — (174,508)
Cash flows from financing activities:
Repurchase of notes payable . . . ............... (270,000) — — (270,000)
Repayment of debt relating to repurchase of common
stock from Barnes & Noble . . ............... (12,173) — — (12,173)
Issuance of shares relating to stock options ........ 64,883 — — 64,883
Excess tax benefits realized from exercise of stock-
based awards . . .......................... 93,322 — — 93,322
Net change in other noncurrent assets and other
intangible assets.......................... 636 6,190 — 6,826
Net cash flows provided by (used in) financing
activities ............................... (123,332) 6,190 — (117,142)
Exchange rate effect on cash and cash equivalents. .... — 11,820 — 11,820
Net increase in cash and cash equivalents . .......... 88,819 116,192 — 205,011
Cash and cash equivalents at beginning of period . .... 582,514 69,889 — 652,403
Cash and cash equivalents at end of period .......... $671,333 $186,081 $— $ 857,414
F-40
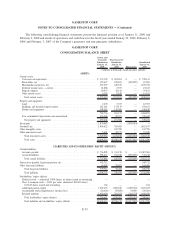
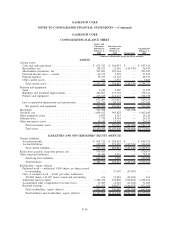
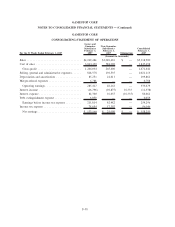
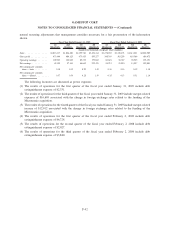
GAMESTOP CORP.
NOTES TO CONSOLIDATED FINANCIAL STATEMENTS — (Continued)