GameStop 2008 Annual Report Download - page 75
Download and view the complete annual report
Please find page 75 of the 2008 GameStop annual report below. You can navigate through the pages in the report by either clicking on the pages listed below, or by using the keyword search tool below to find specific information within the annual report.-
 1
1 -
2
-
3
-
4
-
5
-
6
-
7
-
8
-
9
-
10
-
11
-
12
-
13
-
14
-
15
-
16
-
17
-
18
-
19
-
20
-
21
-
22
-
23
-
24
-
25
-
26
-
27
-
28
-
29
-
30
-
31
-
32
-
33
-
34
-
35
-
36
-
37
-
38
-
39
-
40
-
41
-
42
-
43
-
44
-
45
-
46
-
47
-
48
-
49
-
50
-
51
-
52
-
53
-
54
-
55
-
56
-
57
-
58
-
59
-
60
-
61
-
62
-
63
-
64
-
 65
65 -
 66
66 -
 67
67 -
 68
68 -
 69
69 -
 70
70 -
 71
71 -
 72
72 -
 73
73 -
 74
74 -
 75
75 -
 76
76 -
 77
77 -
 78
78 -
 79
79 -
 80
80 -
 81
81 -
 82
82 -
 83
83 -
 84
84 -
 85
85 -
86
-
87
-
88
-
89
-
90
-
91
-
92
-
93
-
94
-
95
-
96
-
97
-
98
-
99
-
100
-
101
-
102
-
103
-
104
-
105
-
106
-
107
-
108
-
109
-
110
-
111
-
112
-
113
-
114
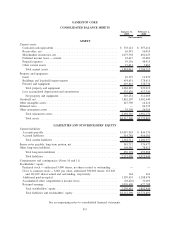
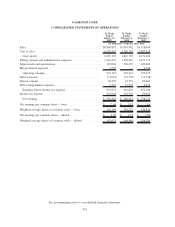
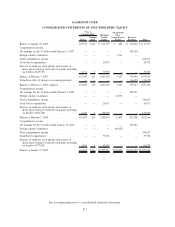
 |
 |

GAMESTOP CORP.
CONSOLIDATED STATEMENTS OF CASH FLOWS
52 Weeks
Ended
January 31,
2009
52 Weeks
Ended
February 2,
2008
53 Weeks
Ended
February 3,
2007
(In thousands)
Cash flows from operating activities:
Net earnings .......................................... $398,282 $ 288,291 $ 158,250
Adjustments to reconcile net earnings to net cash flows provided by
operating activities:
Depreciation and amortization (including amounts in cost of
sales) ............................................ 146,363 131,277 110,176
Provision for inventory reserves .......................... 42,979 51,879 50,779
Amortization and retirement of deferred financing fees ......... 2,496 5,669 4,595
Amortization and retirement of original issue discount on senior
notes ............................................ 1,239 1,162 1,523
Stock-based compensation expense. . ...................... 35,354 26,911 20,978
Deferred taxes ....................................... (25,535) (10,999) (2,522)
Excess tax benefits realized from exercise of stock-based
awards ........................................... (34,174) (93,322) (43,758)
Loss on disposal of property and equipment ................. 5,193 8,205 4,261
Increase in other long-term liabilities ...................... 4,071 8,946 6,775
Increase in liability to landlords for tenant allowances, net ...... 4,266 5,075 1,586
Change in the value of foreign exchange contracts ............ (17,414) 186 (8,323)
Changes in operating assets and liabilities, net of businesses
acquired
Receivables, net .................................... (2,901) (19,903) 4,891
Merchandise inventories .............................. (209,442) (143,525) (115,370)
Prepaid expenses and other current assets ................. (10,111) (3,590) (21,371)
Prepaid taxes and taxes payable . . ...................... 44,698 118,862 54,369
Accounts payable and accrued liabilities .................. 163,871 109,717 193,269
Net cash flows provided by operating activities ............. 549,235 484,841 420,108
Cash flows from investing activities:
Purchase of property and equipment. . . ...................... (183,192) (175,569) (133,930)
Acquisitions, net of cash acquired .......................... (630,706) 1,061 (11,303)
Sale of assets held for sale................................ — — 19,297
Net cash flows used in investing activities .................... (813,898) (174,508) (125,936)
Cash flows from financing activities:
Repurchase of notes payable .............................. (30,000) (270,000) (100,000)
Repayment of other debt ................................. — (12,173) (21,263)
Borrowings for acquisition ................................ 425,000 — —
Repayments of acquisition borrowings . ...................... (425,000) — —
Issuance of shares relating to stock options ................... 28,950 64,883 33,861
Excess tax benefits realized from exercise of stock-based awards . . . 34,174 93,322 43,758
Net change in other noncurrent assets and other intangible assets . . . (10,474) 6,826 385
Net cash flows provided by (used in) financing activities ......... 22,650 (117,142) (43,259)
Exchange rate effect on cash and cash equivalents .............. (37,260) 11,820 (103)
Net increase (decrease) in cash and cash equivalents............. (279,273) 205,011 250,810
Cash and cash equivalents at beginning of period ................. 857,414 652,403 401,593
Cash and cash equivalents at end of period ..................... $578,141 $ 857,414 $ 652,403
See accompanying notes to consolidated financial statements.
F-8