GameStop 2008 Annual Report Download - page 80
Download and view the complete annual report
Please find page 80 of the 2008 GameStop annual report below. You can navigate through the pages in the report by either clicking on the pages listed below, or by using the keyword search tool below to find specific information within the annual report.-
 1
1 -
2
-
3
-
4
-
5
-
6
-
7
-
8
-
9
-
10
-
11
-
12
-
13
-
14
-
15
-
16
-
17
-
18
-
19
-
20
-
21
-
22
-
23
-
24
-
25
-
26
-
27
-
28
-
29
-
30
-
31
-
32
-
33
-
34
-
35
-
36
-
37
-
38
-
39
-
40
-
41
-
42
-
43
-
44
-
45
-
46
-
47
-
48
-
49
-
50
-
51
-
52
-
53
-
54
-
55
-
56
-
57
-
58
-
59
-
60
-
61
-
62
-
63
-
64
-
65
-
66
-
67
-
68
-
69
-
 70
70 -
 71
71 -
 72
72 -
 73
73 -
 74
74 -
 75
75 -
 76
76 -
 77
77 -
 78
78 -
 79
79 -
 80
80 -
 81
81 -
 82
82 -
 83
83 -
 84
84 -
 85
85 -
 86
86 -
 87
87 -
 88
88 -
 89
89 -
 90
90 -
91
-
92
-
93
-
94
-
95
-
96
-
97
-
98
-
99
-
100
-
101
-
102
-
103
-
104
-
105
-
106
-
107
-
108
-
109
-
110
-
111
-
112
-
113
-
114
 |
 |

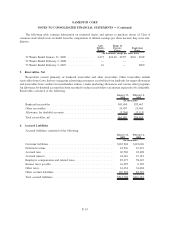
February 3, 2007, respectively. The foreign currency transaction losses in fiscal 2008 are primarily related to the
increase in the value of the U.S. dollar compared to the functional currencies in the countries the Company operates
in internationally, primarily the euro, the Canadian dollar and the Australian dollar. The foreign currency
transaction gains in fiscal 2007 are primarily due to the decrease in the value of the U.S. dollar compared to
the functional currencies in the countries the Company operates in internationally. The net foreign currency
transaction loss in the 52 weeks ended January 31, 2009 included a $3,545 net loss related to the change in foreign
exchange rates related to the funding of the Micromania acquisition recorded in merger-related expenses.
The Company follows the provisions of Statement of Financial Accounting Standards No. 133, Accounting for
Derivative Instruments and Hedging Activities (“SFAS 133”), as amended by Statement of Financial Accounting
Standards No. 138, Accounting for Certain Derivative Instruments and Certain Hedging Activities. SFAS 133
requires that all derivative instruments be recorded on the balance sheet at fair value. Changes in the fair value of
derivatives are recorded each period in current earnings or other comprehensive income, depending on whether the
derivative is designated as part of a hedge transaction, and if it is, depending on the type of hedge transaction.
The Company uses forward exchange contracts, foreign currency options and cross-currency swaps, (together,
the “Foreign Currency Contracts”) to manage currency risk primarily related to intercompany loans denominated in
non-functional currencies and certain foreign currency assets and liabilities. These Foreign Currency Contracts are
not designated as hedges and, therefore, changes in the fair values of these derivatives are recognized in earnings,
thereby offsetting the current earnings effect of the re-measurement of related intercompany loans and foreign
currency assets and liabilities.
Net Earnings Per Common Share
Net earnings per common share is presented in accordance with Statement of Financial Accounting Standards
No. 128, Earnings Per Share (“SFAS 128”). Basic earnings per common share are computed by dividing the net
income available to common stockholders by the weighted average number of common shares outstanding during
the period. Diluted earnings per common share are computed by dividing the net income available to common
stockholders by the weighted average number of common shares outstanding and potentially dilutive securities
outstanding during the period. Potentially dilutive securities include stock options and unvested restricted stock
outstanding during the period, using the treasury stock method. Potentially dilutive securities are excluded from the
computations of diluted earnings per share if their effect would be antidilutive. Note 4 provides additional
information regarding net earnings per common share.
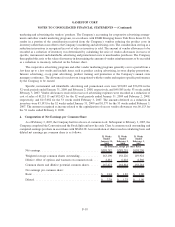
Stock Options
The Company records share-based compensation expense in earnings based on the grant-date fair value of
options granted. The fair value of each option grant is estimated on the date of grant using the Black-Scholes option
pricing model. This valuation model requires the use of subjective assumptions, including expected option life and
expected volatility. The Company uses historical data to estimate the option life and the employee forfeiture rate,
and uses historical volatility when estimating the stock price volatility. The weighted-average fair values of the
options granted during the 52 weeks ended January 31, 2009, the 52 weeks ended February 2, 2008 and the 53 weeks
ended February 3, 2007 were estimated at $15.45, $10.16 and $8.42, respectively, using the following assumptions:
52 Weeks
Ended
January 31,
2009
52 Weeks
Ended
February 2,
2008
53 Weeks
Ended
February 3,
2007
Volatility ....................................... 38.2% 40.5% 54.5%
Risk-free interest rate .............................. 2.4% 4.8% 4.6%
Expected life (years)............................... 3.5 4.0 3.0
Expected dividend yield ............................ 0% 0% 0%
F-13
GAMESTOP CORP.
NOTES TO CONSOLIDATED FINANCIAL STATEMENTS — (Continued)