GameStop 2008 Annual Report Download - page 73
Download and view the complete annual report
Please find page 73 of the 2008 GameStop annual report below. You can navigate through the pages in the report by either clicking on the pages listed below, or by using the keyword search tool below to find specific information within the annual report.-
 1
1 -
2
-
3
-
4
-
5
-
6
-
7
-
8
-
9
-
10
-
11
-
12
-
13
-
14
-
15
-
16
-
17
-
18
-
19
-
20
-
21
-
22
-
23
-
24
-
25
-
26
-
27
-
28
-
29
-
30
-
31
-
32
-
33
-
34
-
35
-
36
-
37
-
38
-
39
-
40
-
41
-
42
-
43
-
44
-
45
-
46
-
47
-
48
-
49
-
50
-
51
-
52
-
53
-
54
-
55
-
56
-
57
-
58
-
59
-
60
-
61
-
62
-
 63
63 -
 64
64 -
 65
65 -
 66
66 -
 67
67 -
 68
68 -
 69
69 -
 70
70 -
 71
71 -
 72
72 -
 73
73 -
 74
74 -
 75
75 -
 76
76 -
 77
77 -
 78
78 -
 79
79 -
 80
80 -
 81
81 -
 82
82 -
 83
83 -
84
-
85
-
86
-
87
-
88
-
89
-
90
-
91
-
92
-
93
-
94
-
95
-
96
-
97
-
98
-
99
-
100
-
101
-
102
-
103
-
104
-
105
-
106
-
107
-
108
-
109
-
110
-
111
-
112
-
113
-
114
 |
 |

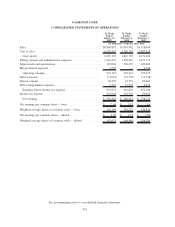
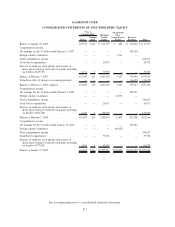
GAMESTOP CORP.
CONSOLIDATED STATEMENTS OF OPERATIONS
52 Weeks
Ended
January 31,
2009
52 Weeks
Ended
February 2,
2008
53 Weeks
Ended
February 3,
2007
(In thousands, except per share data)
Sales ............................................... $8,805,897 $7,093,962 $5,318,900
Cost of sales ......................................... 6,535,762 5,280,255 3,847,458
Gross profit ........................................ 2,270,135 1,813,707 1,471,442
Selling, general and administrative expenses .................. 1,445,419 1,182,016 1,021,113
Depreciation and amortization ............................. 145,004 130,270 109,862
Merger-related expenses ................................. 4,593 — 6,788
Operating earnings ................................... 675,119 501,421 333,679
Interest income ........................................ (11,619) (13,779) (11,338)
Interest expense ....................................... 50,456 61,553 84,662
Debt extinguishment expense ............................. 2,331 12,591 6,059
Earnings before income tax expense ...................... 633,951 441,056 254,296
Income tax expense .................................... 235,669 152,765 96,046
Net earnings ........................................ $ 398,282 $ 288,291 $ 158,250
Net earnings per common share — basic ..................... $ 2.44 $ 1.82 $ 1.06
Weighted average shares of common stock — basic ............. 163,190 158,226 149,924
Net earnings per common share — diluted.................... $ 2.38 $ 1.75 $ 1.00
Weighted average shares of common stock — diluted ........... 167,671 164,844 158,284
See accompanying notes to consolidated financial statements.
F-6