GameStop 2008 Annual Report Download - page 103
Download and view the complete annual report
Please find page 103 of the 2008 GameStop annual report below. You can navigate through the pages in the report by either clicking on the pages listed below, or by using the keyword search tool below to find specific information within the annual report.-
 1
1 -
2
-
3
-
4
-
5
-
6
-
7
-
8
-
9
-
10
-
11
-
12
-
13
-
14
-
15
-
16
-
17
-
18
-
19
-
20
-
21
-
22
-
23
-
24
-
25
-
26
-
27
-
28
-
29
-
30
-
31
-
32
-
33
-
34
-
35
-
36
-
37
-
38
-
39
-
40
-
41
-
42
-
43
-
44
-
45
-
46
-
47
-
48
-
49
-
50
-
51
-
52
-
53
-
54
-
55
-
56
-
57
-
58
-
59
-
60
-
61
-
62
-
63
-
64
-
65
-
66
-
67
-
68
-
69
-
70
-
71
-
72
-
73
-
74
-
75
-
76
-
77
-
78
-
79
-
80
-
81
-
82
-
83
-
84
-
85
-
86
-
87
-
88
-
89
-
90
-
91
-
92
-
 93
93 -
 94
94 -
 95
95 -
 96
96 -
 97
97 -
 98
98 -
 99
99 -
 100
100 -
 101
101 -
 102
102 -
 103
103 -
 104
104 -
 105
105 -
 106
106 -
 107
107 -
 108
108 -
 109
109 -
 110
110 -
 111
111 -
 112
112 -
 113
113 -
114
 |
 |

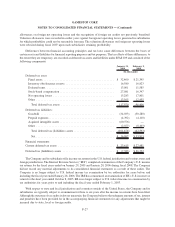
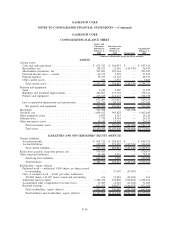
GAMESTOP CORP.
CONSOLIDATING BALANCE SHEET
Issuers and
Guarantor
Subsidiaries
February 2,
2008
Non-Guarantor
Subsidiaries
February 2,
2008 Eliminations
Consolidated
February 2,
2008
(Amounts in thousands, except per share amounts)
ASSETS:
Current assets:
Cash and cash equivalents . . ....................... $ 671,333 $ 186,081 $ — $ 857,414
Receivables, net . . . ............................. 198,923 22,616 (165,520) 56,019
Merchandise inventories, net ....................... 501,861 299,164 — 801,025
Deferred income taxes — current . . .................. 24,153 3,328 — 27,481
Prepaid expenses . . . ............................. 36,793 12,122 — 48,915
Other current assets . ............................. 326 3,537 — 3,863
Total current assets ............................ 1,433,389 526,848 (165,520) 1,794,717
Property and equipment:
Land . ....................................... 2,670 9,200 — 11,870
Buildings and leasehold improvements ................ 246,907 131,704 — 378,611
Fixtures and equipment ........................... 427,623 111,115 — 538,738
677,200 252,019 — 929,219
Less accumulated depreciation and amortization . . ....... 331,176 86,374 — 417,550
Net property and equipment ...................... 346,024 165,645 — 511,669
Investment ...................................... 543,088 — (543,088) —
Goodwill, net . . .................................. 1,096,622 305,818 — 1,402,440
Other intangible assets ............................. 9,899 4,315 — 14,214
Deferred taxes . .................................. 7,378 18,954 — 26,332
Other noncurrent assets ............................. 14,199 12,320 — 26,519
Total noncurrent assets . . . ....................... 2,017,210 507,052 (543,088) 1,981,174
Total assets .................................. $3,450,599 $1,033,900 $(708,608) $3,775,891
LIABILITIES AND STOCKHOLDERS’ EQUITY (DEFICIT):
Current liabilities:
Accounts payable . . ............................. $ 635,722 $ 208,654 $ — $ 844,376
Accrued liabilities . . ............................. 309,472 272,229 (165,520) 416,181
Total current liabilities . . . ....................... 945,194 480,883 (165,520) 1,260,557
Senior notes payable, long-term portion, net . . ............ 574,473 — — 574,473
Other long-term liabilities ........................... 68,486 9,929 — 78,415
Total long-term liabilities . ....................... 642,959 9,929 — 652,888
Total liabilities . . ............................. 1,588,153 490,812 (165,520) 1,913,445
Stockholders’ equity (deficit):
Preferred stock — authorized 5,000 shares; no shares issued
or outstanding . . . ............................. — 57,407 (57,407) —
Class A common stock — $.001 par value; authorized
300,000 shares; 161,007 shares issued and outstanding . . . 161 31,484 (31,484) 161
Additional paid-in-capital . . . ....................... 1,208,474 296,860 (296,860) 1,208,474
Accumulated other comprehensive income (loss) . . ....... 31,603 11,262 (11,262) 31,603
Retained earnings . . ............................. 622,208 146,075 (146,075) 622,208
Total stockholders’ equity (deficit) ................. 1,862,446 543,088 (543,088) 1,862,446
Total liabilities and stockholders’ equity (deficit) ....... $3,450,599 $1,033,900 $(708,608) $3,775,891
F-36
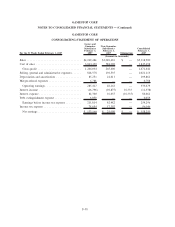
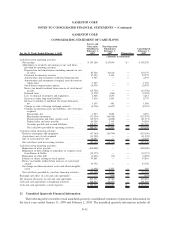
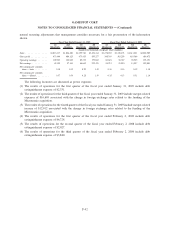
GAMESTOP CORP.
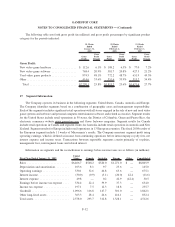
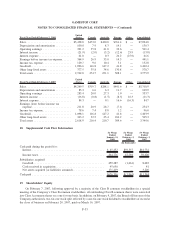
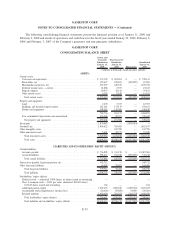
NOTES TO CONSOLIDATED FINANCIAL STATEMENTS — (Continued)