GameStop 2008 Annual Report Download - page 48
Download and view the complete annual report
Please find page 48 of the 2008 GameStop annual report below. You can navigate through the pages in the report by either clicking on the pages listed below, or by using the keyword search tool below to find specific information within the annual report.-
 1
1 -
2
-
3
-
4
-
5
-
6
-
7
-
8
-
9
-
10
-
11
-
12
-
13
-
14
-
15
-
16
-
17
-
18
-
19
-
20
-
21
-
22
-
23
-
24
-
25
-
26
-
27
-
28
-
29
-
30
-
31
-
32
-
33
-
34
-
35
-
36
-
37
-
 38
38 -
 39
39 -
 40
40 -
 41
41 -
 42
42 -
 43
43 -
 44
44 -
 45
45 -
 46
46 -
 47
47 -
 48
48 -
 49
49 -
 50
50 -
 51
51 -
 52
52 -
 53
53 -
 54
54 -
 55
55 -
 56
56 -
 57
57 -
 58
58 -
59
-
60
-
61
-
62
-
63
-
64
-
65
-
66
-
67
-
68
-
69
-
70
-
71
-
72
-
73
-
74
-
75
-
76
-
77
-
78
-
79
-
80
-
81
-
82
-
83
-
84
-
85
-
86
-
87
-
88
-
89
-
90
-
91
-
92
-
93
-
94
-
95
-
96
-
97
-
98
-
99
-
100
-
101
-
102
-
103
-
104
-
105
-
106
-
107
-
108
-
109
-
110
-
111
-
112
-
113
-
114
 |
 |
premiums paid related to debt retirement and the recognition of deferred financing fees and unamortized original
issue discount.
Income tax expense increased by $82.9 million, from $152.8 million in fiscal 2007 to $235.7 million in fiscal
2008. The Company’s effective tax rate increased from 34.6% in fiscal 2007 to 37.2% in fiscal 2008 due to expenses
related to mergers and acquisitions and associated corporate structuring and the deemed repatriation of earnings
from foreign subsidiaries. In addition, during fiscal 2007 there were valuation allowances released on foreign net
operating losses. See Note 12 of “Notes to Consolidated Financial Statements” for additional information regarding
income taxes.
The factors described above led to an increase in operating earnings of $173.7 million, or 34.6%, from
$501.4 million in fiscal 2007 to $675.1 million in fiscal 2008 and an increase in net earnings of $110.0 million, or
38.2%, from $288.3 million in fiscal 2007 to $398.3 million in fiscal 2008.
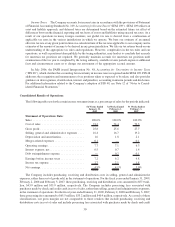
Fiscal 2007 Compared to Fiscal 2006
Sales increased by $1,775.1 million, or 33.4%, to $7,094.0 million in the 52 weeks of fiscal 2007 compared to
$5,318.9 million in the 53 weeks of fiscal 2006. The increase in sales was attributable to the comparable store sales
increase of 24.7% for fiscal 2007 when compared to fiscal 2006, the addition of non-comparable store sales from the
1,007 stores opened since January 29, 2006 of approximately $496.2 million and increases related to changes in
foreign exchange rates of $109.4 million, offset by sales of $99.1 million for the 53rd week included in fiscal 2006.
The comparable store sales increase was driven by continued strong sales of the Nintendo Wii, Microsoft’s Xbox
360 and the Sony PlayStation 3, which completed its worldwide launch during fiscal 2007, and their related
software and accessories, including several strong video game titles, such as Halo 3 and Guitar Hero III. The
comparable store sales increase of 24.7% was calculated by using the 52 weeks of fiscal 2007 compared to the most
closely comparable 52 weeks of fiscal 2006 with consideration given to the timing of holidays to ensure
comparability.
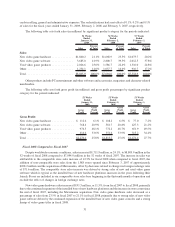
New video game hardware sales increased $595.2 million, or 55.4%, from fiscal 2006 to fiscal 2007, primarily
due to the sales of hardware units mentioned above, as well as the increase in store count since January 2007, offset
by the 53rd week of sales included in fiscal 2006. New video game hardware sales increased as a percentage of sales
from 20.2% in fiscal 2006 to 23.5% in fiscal 2007, primarily due to the first full year since the Nintendo Wii and the
Sony PlayStation 3 launch as well as increasing sales of Microsoft Xbox 360 and the Nintendo DS.
New video game software sales increased $788.2 million, or 39.2%, from fiscal 2006 to fiscal 2007, primarily
due to new stores added in fiscal 2007, sales related to the new hardware platforms and a strong lineup of new video
game titles released during the 52 weeks ended February 2, 2008. New video game software sales as a percentage of
total sales increased from 37.8% in fiscal 2006 to 39.5% in fiscal 2007 due to increased sales related to the new
hardware platforms and the availability of several strong titles in fiscal 2007.
Used video game product sales increased $270.7 million, or 20.6%, from fiscal 2006 to fiscal 2007, primarily
due to the increase in new store count, an increase in overall demand for video game products following the launch
of new hardware platforms and the strong growth of used video game product sales internationally, offset by the
53rd week of sales in fiscal 2006. As a percentage of sales, used video game product sales decreased from 24.8% to
22.4% primarily due to the strong sales of new video game hardware and software. Sales of other product
categories, including PC entertainment and other software and accessories, magazines and trading cards, grew
13.2%, or $121.0 million, from fiscal 2006 to fiscal 2007, primarily due to the increase in store count and the
increase in new hardware platform accessories sales, offset by the 53rd week of sales in fiscal 2006.
Cost of sales increased by $1,432.8 million, or 37.2%, from $3,847.5 million in fiscal 2006 to $5,280.3 million
in fiscal 2007 as a result of the increase in sales and the changes in gross profit discussed below, offset by the
53rd week of sales in fiscal 2006.
Gross profit increased by $342.3 million, or 23.3%, from $1,471.4 million in fiscal 2006 to $1,813.7 million in
fiscal 2007. Gross profit as a percentage of sales decreased from 27.7% in fiscal 2006 to 25.6% in fiscal 2007. The
gross profit percentage decrease was caused primarily by the increase in sales of new video game hardware as a
percentage of total sales in fiscal 2007. New video game hardware typically carries a much lower margin than sales
33