GameStop 2008 Annual Report Download - page 53
Download and view the complete annual report
Please find page 53 of the 2008 GameStop annual report below. You can navigate through the pages in the report by either clicking on the pages listed below, or by using the keyword search tool below to find specific information within the annual report.-
 1
1 -
2
-
3
-
4
-
5
-
6
-
7
-
8
-
9
-
10
-
11
-
12
-
13
-
14
-
15
-
16
-
17
-
18
-
19
-
20
-
21
-
22
-
23
-
24
-
25
-
26
-
27
-
28
-
29
-
30
-
31
-
32
-
33
-
34
-
35
-
36
-
37
-
38
-
39
-
40
-
41
-
42
-
 43
43 -
 44
44 -
 45
45 -
 46
46 -
 47
47 -
 48
48 -
 49
49 -
 50
50 -
 51
51 -
 52
52 -
 53
53 -
 54
54 -
 55
55 -
 56
56 -
 57
57 -
 58
58 -
 59
59 -
 60
60 -
 61
61 -
 62
62 -
 63
63 -
64
-
65
-
66
-
67
-
68
-
69
-
70
-
71
-
72
-
73
-
74
-
75
-
76
-
77
-
78
-
79
-
80
-
81
-
82
-
83
-
84
-
85
-
86
-
87
-
88
-
89
-
90
-
91
-
92
-
93
-
94
-
95
-
96
-
97
-
98
-
99
-
100
-
101
-
102
-
103
-
104
-
105
-
106
-
107
-
108
-
109
-
110
-
111
-
112
-
113
-
114
 |
 |
Europe
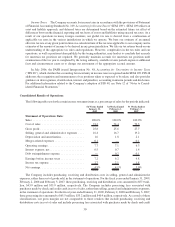
Segment results for Europe include retail operations in 12 European countries including Portugal, which
commenced operations in the first quarter of fiscal 2007. As of February 2, 2008, the European segment operated
636 stores, compared to 493 stores as of February 3, 2007. For the 52 weeks ended February 2, 2008, European sales
increased 72.4% compared to the 53 weeks ended February 3, 2007. The increase in sales was primarily due to the
increase in sales at existing stores and the additional sales at the 271 stores opened since January 28, 2006. The
increase in store count was offset by store closings in the first quarter of fiscal 2007, primarily in Spain, as part of the
implementation of the integration strategy of the acquisition of EB. The increase in sales at existing stores was
driven by strong sales of the Sony PlayStation 3, which launched in Europe during the first quarter of fiscal 2007, as
well as strong sales of other video game hardware, including the Nintendo Wii, and increased sales of Microsoft’s
Xbox 360 and handheld video game systems during fiscal 2007 compared to fiscal 2006. The increased hardware
sales led to increases in sales in new video game software, used video game products and accessories and other
products.
The segment operating income in Europe for the 52 weeks ended February 2, 2008 increased to $32.6 million
compared to $1.0 million in the 53 weeks ended February 3, 2007. The increase in the operating income was driven
by the increase in sales and related margin dollars discussed above, the leveraging of selling, general and
administrative expenses, both of which reflect the continued maturation of our operations in the European market,
and the favorable impact of changes in exchange rates since the prior year. For the 52 weeks ended February 2, 2008,
changes in exchange rates when compared to fiscal 2006 had the effect of increasing operating earnings by
$2.7 million.
Liquidity and Capital Resources
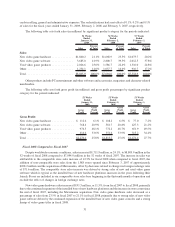
Cash Flows
During fiscal 2008, cash provided by operations was $549.2 million, compared to cash provided by operations
of $484.8 million in fiscal 2007. The increase in cash provided by operations of $64.4 million from fiscal 2007 to
fiscal 2008 was primarily due to an increase in cash provided by net earnings, including the non-cash adjustments to
net earnings, of $80.7 million and a decrease in the excess tax benefits realized from the exercise of stock-based
awards of $59.1 million. These amounts were offset by an increase in cash used in operations for working capital of
$75.4 million from fiscal 2007 to fiscal 2008 primarily due to an increase in merchandise inventories resulting from
an increase in store count and sales levels.
During fiscal 2007, cash provided by operations was $484.8 million, compared to cash provided by operations
of $420.1 million in fiscal 2006. The increase in cash provided by operations of $64.7 million from fiscal 2006 to
fiscal 2007 was primarily due to an increase in the cash provided by net earnings, including the non-cash
adjustments to net earnings, of $168.5 million offset by an increase in the excess tax benefits realized from the
exercise of stock-based awards of $49.5 million. These amounts were offset by a net decrease in cash provided by
operations for working capital of $54.3 million from fiscal 2006 to fiscal 2007 due primarily to an increase in
merchandise inventories resulting from an increase in store count and sales.
Cash used in investing activities was $813.9 million in fiscal 2008, $174.5 million during fiscal 2007 and
$125.9 million during fiscal 2006. During fiscal 2008, the Company used $580.4 million, net of cash acquired, to
purchase Micromania and $50.3 million, net of cash acquired, to acquire FRS, The Gamesman Limited and an
increased ownership interest in GameStop Group Limited. In addition, during fiscal 2008, $183.2 million of cash
was used for capital expenditures primarily to open 674 new stores in the United States and internationally and to
invest in information systems. During fiscal 2007, $175.6 million of cash was used for capital expenditures
primarily to open 586 stores in the United States and internationally and to invest in information systems, which
were offset by $1.1 million of cash received related to the finalization of the purchase price of Game Brands Inc.
which was acquired during the fourth quarter of fiscal 2006. During fiscal 2006, $133.9 million of cash was used for
capital expenditures primarily to invest in information and distribution systems in support of the integration of the
operations of EB, to open new stores in the United States and for international expansion. Also, during the fourth
quarter of fiscal 2006, the Company purchased Game Brands Inc., a 72-store video game retailer, for $11.3 million.
38