GameStop 2008 Annual Report Download - page 47
Download and view the complete annual report
Please find page 47 of the 2008 GameStop annual report below. You can navigate through the pages in the report by either clicking on the pages listed below, or by using the keyword search tool below to find specific information within the annual report.-
 1
1 -
2
-
3
-
4
-
5
-
6
-
7
-
8
-
9
-
10
-
11
-
12
-
13
-
14
-
15
-
16
-
17
-
18
-
19
-
20
-
21
-
22
-
23
-
24
-
25
-
26
-
27
-
28
-
29
-
30
-
31
-
32
-
33
-
34
-
35
-
36
-
 37
37 -
 38
38 -
 39
39 -
 40
40 -
 41
41 -
 42
42 -
 43
43 -
 44
44 -
 45
45 -
 46
46 -
 47
47 -
 48
48 -
 49
49 -
 50
50 -
 51
51 -
 52
52 -
 53
53 -
 54
54 -
 55
55 -
 56
56 -
 57
57 -
58
-
59
-
60
-
61
-
62
-
63
-
64
-
65
-
66
-
67
-
68
-
69
-
70
-
71
-
72
-
73
-
74
-
75
-
76
-
77
-
78
-
79
-
80
-
81
-
82
-
83
-
84
-
85
-
86
-
87
-
88
-
89
-
90
-
91
-
92
-
93
-
94
-
95
-
96
-
97
-
98
-
99
-
100
-
101
-
102
-
103
-
104
-
105
-
106
-
107
-
108
-
109
-
110
-
111
-
112
-
113
-
114
 |
 |
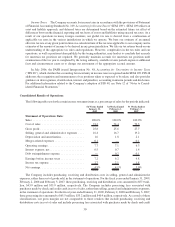
New video game software sales increased $884.3 million, or 31.6%, from fiscal 2007 to fiscal 2008, primarily
due to the strong sales of new video game titles released in fiscal 2008 and the increased sales of software related to
the new hardware platforms, as well as the new and acquired stores added since the end of fiscal 2007. New video
game software sales increased as a percentage of total sales from 39.5% in fiscal 2007 to 41.9% in fiscal 2008 due to
the continued expansion of the installed base of new video game consoles, as well as the availability of several
strong new titles in fiscal 2008.
Used video game product sales increased $439.9 million, or 27.7%, from fiscal 2007 to fiscal 2008, primarily
due to an increase in store count and an increase in the availability of hardware and software associated with the new
hardware platforms as those platforms age and expand. As a percentage of sales, used video game product sales
increased from 22.4% to 23.0% primarily due to the continued expansion of the installed base of new video game
consoles and the availability of used hardware and software from those consoles. Sales of other product categories,
including PC entertainment and other software and accessories, magazines and trading cards, grew 18.9%, or
$196.4 million, from fiscal 2007 to fiscal 2008, primarily due to the increase in store count and strong sales of new
PC entertainment software and sales of accessories related to the new hardware platforms.
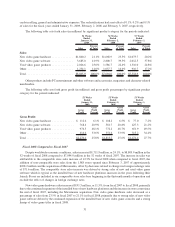
Cost of sales increased by $1,255.5 million, or 23.8%, from $5,280.3 million in fiscal 2007 to $6,535.8 million
in fiscal 2008 as a result of the increase in sales and the changes in gross profit discussed below.
Gross profit increased by $456.4 million, or 25.2%, from $1,813.7 million in fiscal 2007 to $2,270.1 million in
fiscal 2008. Gross profit as a percentage of sales increased from 25.6% in fiscal 2007 to 25.8% in fiscal 2008. The
gross profit percentage increase was caused primarily by the shift in sales from new video game hardware to new
video game software and used video game products as a percentage of total sales in fiscal 2008 as the new platforms
mature. These product categories carry a significantly higher margin than new video game hardware. Gross profit as
a percentage of sales on new video game hardware decreased from 6.5% in fiscal 2007 to 6.1% in fiscal 2008 due
primarily to a decrease in product replacement plan sales. Gross profit as a percentage of sales on new video game
software and other products remained relatively consistent from 20.8% and 33.9%, respectively, in fiscal 2007
compared to 20.9% and 33.6%, respectively, in fiscal 2008. Gross profit as a percentage of sales on used video game
products decreased from 48.7% in fiscal 2007 to 48.1% in fiscal 2008 due to increased promotional activities and
higher refurbishment costs associated with an increase in production of refurbished hardware platforms during
fiscal 2008.
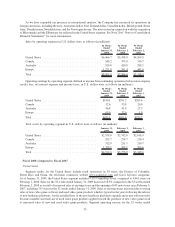
Selling, general and administrative expenses increased by $263.4 million, or 22.3%, from $1,182.0 million in
fiscal 2007 to $1,445.4 million in fiscal 2008. The increase was primarily attributable to the increase in the number
of stores in operation, and the related increases in store, distribution and corporate office operating expenses.
Selling, general and administrative expenses as a percentage of sales decreased from 16.7% in fiscal 2007 to 16.4%
in fiscal 2008. The decrease in selling, general and administrative expenses as a percentage of sales was primarily
due to leveraging as a result of the higher sales associated with the growth of the video game market and cost control
efforts. Selling, general and administrative expenses include $35.4 million and $26.9 million in stock-based
compensation expense for fiscal 2008 and fiscal 2007, respectively. Foreign currency transaction gains and (losses)
are included in selling, general and administrative expenses and amounted to ($6.4) million in fiscal 2008,
compared to $8.6 million in fiscal 2007.
Depreciation and amortization expense increased from $130.3 million in fiscal 2007 to $145.0 million in fiscal
2008. This increase of $14.7 million was due primarily to capital expenditures associated with the opening of 674
new stores during fiscal 2008. Depreciation and amortization expense will increase from fiscal 2008 to the 52 week
period ending January 30, 2010 (“fiscal 2009”) due to continued capital expenditures for new stores and
investments in management information systems.
Interest income from the investment of excess cash balances decreased from $13.8 million in fiscal 2007 to
$11.6 million in fiscal 2008 as a result of lower invested cash balances due to acquisitions and lower interest rates.
Interest expense decreased from $61.6 million in fiscal 2007 to $50.5 million in fiscal 2008, primarily due to the
retirement of $30.0 million of the Company’s senior notes since February 2, 2008 and the retirement of
$270.0 million in senior notes and senior floating rate notes during fiscal 2007. Debt extinguishment expense
of $2.3 million and $12.6 million was recognized in fiscal 2008 and fiscal 2007, respectively, as a result of the
32