GameStop 2008 Annual Report Download - page 108
Download and view the complete annual report
Please find page 108 of the 2008 GameStop annual report below. You can navigate through the pages in the report by either clicking on the pages listed below, or by using the keyword search tool below to find specific information within the annual report.-
 1
1 -
2
-
3
-
4
-
5
-
6
-
7
-
8
-
9
-
10
-
11
-
12
-
13
-
14
-
15
-
16
-
17
-
18
-
19
-
20
-
21
-
22
-
23
-
24
-
25
-
26
-
27
-
28
-
29
-
30
-
31
-
32
-
33
-
34
-
35
-
36
-
37
-
38
-
39
-
40
-
41
-
42
-
43
-
44
-
45
-
46
-
47
-
48
-
49
-
50
-
51
-
52
-
53
-
54
-
55
-
56
-
57
-
58
-
59
-
60
-
61
-
62
-
63
-
64
-
65
-
66
-
67
-
68
-
69
-
70
-
71
-
72
-
73
-
74
-
75
-
76
-
77
-
78
-
79
-
80
-
81
-
82
-
83
-
84
-
85
-
86
-
87
-
88
-
89
-
90
-
91
-
92
-
93
-
94
-
95
-
96
-
97
-
 98
98 -
 99
99 -
 100
100 -
 101
101 -
 102
102 -
 103
103 -
 104
104 -
 105
105 -
 106
106 -
 107
107 -
 108
108 -
 109
109 -
 110
110 -
 111
111 -
 112
112 -
 113
113 -
 114
114
 |
 |

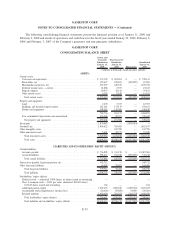
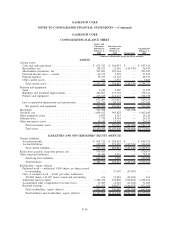
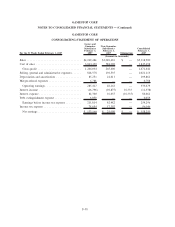
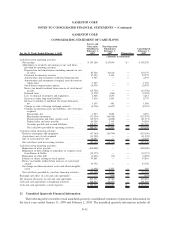
GAMESTOP CORP.
CONSOLIDATING STATEMENT OF CASH FLOWS
For the 53 Weeks Ended February 3, 2007
Issuers and
Guarantor
Subsidiaries
February 3,
2007
Non-Guarantor
Subsidiaries
February 3,
2007 Eliminations
Consolidated
February 3,
2007
(Amounts in thousands)
Cash flows from operating activities:
Net earnings . . . . . . . . . . . . . . . . . . . . . . . . . . . . . . . . . . $ 133,160 $ 25,090 $— $ 158,250
Adjustments to reconcile net earnings to net cash flows
provided by operating activities:
Depreciation and amortization (including amounts in cost
of sales) . . . . . . . . . . . . . . . . . . . . . . . . . . . . . . . . . 85,566 24,610 — 110,176
Provision for inventory reserves . . . . . . . . . . . . . . . . . . . 47,325 3,454 — 50,779
Amortization and retirement of deferred financing fees . . . 4,595 — — 4,595
Amortization and retirement of original issue discount on
senior notes . . . . . . . . . . . . . . . . . . . . . . . . . . . . . . . 1,523 — — 1,523
Stock-based compensation expense . . . . . . . . . . . . . . . . . 20,978 — — 20,978
Excess tax benefits realized from exercise of stock-based
awards . . . . . . . . . . . . . . . . . . . . . . . . . . . . . . . . . . (43,758) — — (43,758)
Deferred taxes . . . . . . . . . . . . . . . . . . . . . . . . . . . . . . . (1,578) (944) — (2,522)
Loss on disposal of property and equipment . . . . . . . . . . . 2,606 1,655 — 4,261
Increase in other long-term liabilities . . . . . . . . . . . . . . . 5,410 1,365 — 6,775
Increase in liability to landlords for tenant allowances,
net . . . . . . . . . . . . . . . . . . . . . . . . . . . . . . . . . . . . . 1,105 481 — 1,586
Change in value of foreign exchange contracts . . . . . . . . . (6,716) (1,607) — (8,323)
Changes in operating assets and liabilities, net of business
acquired
Receivables, net . . . . . . . . . . . . . . . . . . . . . . . . . . . 1,253 3,638 — 4,891
Merchandise inventories. . . . . . . . . . . . . . . . . . . . . . . (71,334) (44,036) — (115,370)
Prepaid expenses and other current assets . . . . . . . . . . . (19,513) (1,858) — (21,371)
Prepaid taxes and taxes payable . . . . . . . . . . . . . . . . . 49,206 5,163 — 54,369
Accounts payable and accrued liabilities . . . . . . . . . . . . 178,417 14,852 — 193,269
Net cash flows provided by operating activities . . . . . . . 388,245 31,863 — 420,108
Cash flows from investing activities:
Purchase of property and equipment . . . . . . . . . . . . . . . . . . (97,140) (36,790) — (133,930)
Acquisitions, net of cash acquired . . . . . . . . . . . . . . . . . . . (11,303) — — (11,303)
Sale of assets held for sale . . . . . . . . . . . . . . . . . . . . . . . . 19,297 — — 19,297
Net cash flows used in investing activities . . . . . . . . . . . . . . (89,146) (36,790) — (125,936)
Cash flows from financing activities:
Repurchase of notes payable . . . . . . . . . . . . . . . . . . . . . . . (100,000) — — (100,000)
Repayment of debt relating to repurchase of common stock
from Barnes & Noble . . . . . . . . . . . . . . . . . . . . . . . . . . (12,173) — — (12,173)
Repayment of other debt . . . . . . . . . . . . . . . . . . . . . . . . . (9,016) (74) — (9,090)
Issuance of shares relating to stock options . . . . . . . . . . . . . 33,861 — — 33,861
Excess tax benefits realized from exercise of stock-based
awards . . . . . . . . . . . . . . . . . . . . . . . . . . . . . . . . . . . . 43,758 — — 43,758
Net change in other noncurrent assets and other intangible
assets . . . . . . . . . . . . . . . . . . . . . . . . . . . . . . . . . . . . . (1,938) 2,323 — 385
Net cash flows provided by (used in) financing activities . . . . (45,508) 2,249 — (43,259)
Exchange rate effect on cash and cash equivalents . . . . . . . . . . — (103) — (103)
Net increase (decrease) in cash and cash equivalents . . . . . . . . 253,591 (2,781) — 250,810
Cash and cash equivalents at beginning of period. . . . . . . . . . . 328,923 72,670 — 401,593
Cash and cash equivalents at end of period . . . . . . . . . . . . . . . $ 582,514 $ 69,889 $— $ 652,403
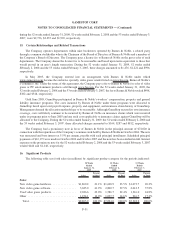
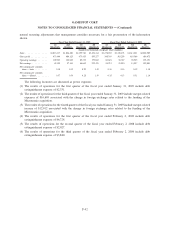
21. Unaudited Quarterly Financial Information
The following table sets forth certain unaudited quarterly consolidated statement of operations information for
the fiscal years ended January 31, 2009 and February 2, 2008. The unaudited quarterly information includes all
F-41
GAMESTOP CORP.
NOTES TO CONSOLIDATED FINANCIAL STATEMENTS — (Continued)