GameStop 2008 Annual Report Download - page 74
Download and view the complete annual report
Please find page 74 of the 2008 GameStop annual report below. You can navigate through the pages in the report by either clicking on the pages listed below, or by using the keyword search tool below to find specific information within the annual report.-
 1
1 -
2
-
3
-
4
-
5
-
6
-
7
-
8
-
9
-
10
-
11
-
12
-
13
-
14
-
15
-
16
-
17
-
18
-
19
-
20
-
21
-
22
-
23
-
24
-
25
-
26
-
27
-
28
-
29
-
30
-
31
-
32
-
33
-
34
-
35
-
36
-
37
-
38
-
39
-
40
-
41
-
42
-
43
-
44
-
45
-
46
-
47
-
48
-
49
-
50
-
51
-
52
-
53
-
54
-
55
-
56
-
57
-
58
-
59
-
60
-
61
-
62
-
63
-
 64
64 -
 65
65 -
 66
66 -
 67
67 -
 68
68 -
 69
69 -
 70
70 -
 71
71 -
 72
72 -
 73
73 -
 74
74 -
 75
75 -
 76
76 -
 77
77 -
 78
78 -
 79
79 -
 80
80 -
 81
81 -
 82
82 -
 83
83 -
 84
84 -
85
-
86
-
87
-
88
-
89
-
90
-
91
-
92
-
93
-
94
-
95
-
96
-
97
-
98
-
99
-
100
-
101
-
102
-
103
-
104
-
105
-
106
-
107
-
108
-
109
-
110
-
111
-
112
-
113
-
114
 |
 |

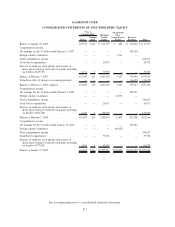
GAMESTOP CORP.
CONSOLIDATED STATEMENTS OF STOCKHOLDERS’ EQUITY
Shares
Common
Stock
Additional
Paid-in
Capital
Accumulated
Other
Comprehensive
Income
Retained
Earnings Total
Class A
Common Stock
Balance at January 28, 2006 . . . . . . . . . . . . . . . . . . . . 145,594 $146 $ 921,335 $ 886 $ 192,346 $1,114,713
Comprehensive income:
Net earnings for the 53 weeks ended February 3, 2007 . . — — — — 158,250
Foreign currency translation . . . . . . . . . . . . . . . . . . . . — — — 2,341 —
Total comprehensive income . . . . . . . . . . . . . . . . . . . . 160,591
Stock-based compensation . . . . . . . . . . . . . . . . . . . . . — — 20,978 — — 20,978
Exercise of employee stock options and issuance of
shares upon vesting of restricted stock grant (including
tax benefit of $45,735) . . . . . . . . . . . . . . . . . . . . . . 6,711 6 79,590 — — 79,596
Balance at February 3, 2007 . . . . . . . . . . . . . . . . . . . . 152,305 152 1,021,903 3,227 350,596 1,375,878
Cumulative effect of change in accounting principle . . . . — — — — (16,679) (16,679)
Balance at February 4, 2007, adjusted . . . . . . . . . . . . . 152,305 152 1,021,903 3,227 333,917 1,359,199
Comprehensive income:
Net earnings for the 52 weeks ended February 2, 2008 . . — — — — 288,291
Foreign currency translation . . . . . . . . . . . . . . . . . . . . — — — 28,376 —
Total comprehensive income . . . . . . . . . . . . . . . . . . . . 316,667
Stock-based compensation . . . . . . . . . . . . . . . . . . . . . — — 26,911 — — 26,911
Exercise of employee stock options and issuance of
shares upon vesting of restricted stock grant (including
tax benefit of $94,786) . . . . . . . . . . . . . . . . . . . . . . 8,702 9 159,660 — — 159,669
Balance at February 2, 2008 . . . . . . . . . . . . . . . . . . . . 161,007 161 1,208,474 31,603 622,208 1,862,446
Comprehensive income:
Net earnings for the 52 weeks ended January 31, 2009 . . — — — — 398,282
Foreign currency translation . . . . . . . . . . . . . . . . . . . . — — — (60,029) —
Total comprehensive income . . . . . . . . . . . . . . . . . . . . 338,253
Stock-based compensation . . . . . . . . . . . . . . . . . . . . . — — 35,354 — — 35,354
Exercise of employee stock options and issuance of
shares upon vesting of restricted stock grant (including
tax benefit of $37,562) . . . . . . . . . . . . . . . . . . . . . . 2,836 3 63,625 — — 63,628
Balance at January 31, 2009 . . . . . . . . . . . . . . . . . . . . 163,843 $164 $1,307,453 $(28,426) $1,020,490 $2,299,681
See accompanying notes to consolidated financial statements.
F-7