GameStop 2008 Annual Report Download - page 72
Download and view the complete annual report
Please find page 72 of the 2008 GameStop annual report below. You can navigate through the pages in the report by either clicking on the pages listed below, or by using the keyword search tool below to find specific information within the annual report.-
 1
1 -
2
-
3
-
4
-
5
-
6
-
7
-
8
-
9
-
10
-
11
-
12
-
13
-
14
-
15
-
16
-
17
-
18
-
19
-
20
-
21
-
22
-
23
-
24
-
25
-
26
-
27
-
28
-
29
-
30
-
31
-
32
-
33
-
34
-
35
-
36
-
37
-
38
-
39
-
40
-
41
-
42
-
43
-
44
-
45
-
46
-
47
-
48
-
49
-
50
-
51
-
52
-
53
-
54
-
55
-
56
-
57
-
58
-
59
-
60
-
61
-
 62
62 -
 63
63 -
 64
64 -
 65
65 -
 66
66 -
 67
67 -
 68
68 -
 69
69 -
 70
70 -
 71
71 -
 72
72 -
 73
73 -
 74
74 -
 75
75 -
 76
76 -
 77
77 -
 78
78 -
 79
79 -
 80
80 -
 81
81 -
 82
82 -
83
-
84
-
85
-
86
-
87
-
88
-
89
-
90
-
91
-
92
-
93
-
94
-
95
-
96
-
97
-
98
-
99
-
100
-
101
-
102
-
103
-
104
-
105
-
106
-
107
-
108
-
109
-
110
-
111
-
112
-
113
-
114
 |
 |

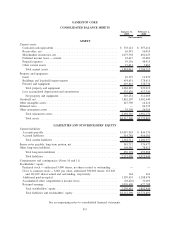
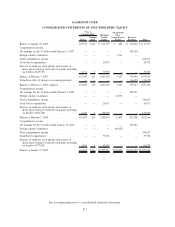
GAMESTOP CORP.
CONSOLIDATED BALANCE SHEETS
January 31,
2009
February 2,
2008
(In thousands)
ASSETS
Current assets:
Cash and cash equivalents ......................................... $ 578,141 $ 857,414
Receivables, net ................................................ 65,981 56,019
Merchandise inventories, net ....................................... 1,075,792 801,025
Deferred income taxes — current ................................... 23,615 27,481
Prepaid expenses ............................................... 59,101 48,915
Other current assets ............................................. 15,411 3,863
Total current assets ............................................ 1,818,041 1,794,717
Property and equipment:
Land ........................................................ 10,397 11,870
Buildings and leasehold improvements ............................... 454,651 378,611
Fixtures and equipment ........................................... 619,845 538,738
Total property and equipment .................................... 1,084,893 929,219
Less accumulated depreciation and amortization ........................ 535,639 417,550
Net property and equipment ..................................... 549,254 511,669
Goodwill, net .................................................... 1,862,107 1,402,440
Other intangible assets ............................................. 247,790 14,214
Deferred taxes ................................................... — 26,332
Other noncurrent assets ............................................ 35,398 26,519
Total noncurrent assets ......................................... 2,694,549 1,981,174
Total assets .................................................. $4,512,590 $3,775,891
LIABILITIES AND STOCKHOLDERS’ EQUITY
Current liabilities:
Accounts payable ............................................... $1,047,963 $ 844,376
Accrued liabilities............................................... 514,748 416,181
Total current liabilities ......................................... 1,562,711 1,260,557
Senior notes payable, long-term portion, net ............................. 545,712 574,473
Other long-term liabilities ........................................... 104,486 78,415
Total long-term liabilities ....................................... 650,198 652,888
Total liabilities ............................................... 2,212,909 1,913,445
Commitments and contingencies (Notes 10 and 11)
Stockholders’ equity:
Preferred stock — authorized 5,000 shares; no shares issued or outstanding .... — —
Class A common stock — $.001 par value; authorized 300,000 shares; 163,843
and 161,007 shares issued and outstanding, respectively ................. 164 161
Additional paid-in-capital ......................................... 1,307,453 1,208,474
Accumulated other comprehensive income (loss) ........................ (28,426) 31,603
Retained earnings ............................................... 1,020,490 622,208
Total stockholders’ equity ....................................... 2,299,681 1,862,446
Total liabilities and stockholders’ equity . . . ......................... $4,512,590 $3,775,891
See accompanying notes to consolidated financial statements.
F-5