GNC 2009 Annual Report Download - page 74
Download and view the complete annual report
Please find page 74 of the 2009 GNC annual report below. You can navigate through the pages in the report by either clicking on the pages listed below, or by using the keyword search tool below to find specific information within the annual report.-
 1
1 -
2
-
3
-
4
-
5
-
6
-
7
-
8
-
9
-
10
-
11
-
12
-
13
-
14
-
15
-
16
-
17
-
18
-
19
-
20
-
21
-
22
-
23
-
24
-
25
-
26
-
27
-
28
-
29
-
30
-
31
-
32
-
33
-
34
-
35
-
36
-
37
-
38
-
39
-
40
-
41
-
42
-
43
-
44
-
45
-
46
-
47
-
48
-
49
-
50
-
51
-
52
-
53
-
54
-
55
-
56
-
57
-
58
-
59
-
60
-
61
-
62
-
63
-
 64
64 -
 65
65 -
 66
66 -
 67
67 -
 68
68 -
 69
69 -
 70
70 -
 71
71 -
 72
72 -
 73
73 -
 74
74 -
 75
75 -
 76
76 -
 77
77 -
 78
78 -
 79
79 -
 80
80 -
 81
81 -
 82
82 -
 83
83 -
 84
84 -
85
-
86
-
87
-
88
-
89
-
90
-
91
-
92
-
93
-
94
-
95
-
96
-
97
-
98
-
99
-
100
-
101
-
102
-
103
-
104
-
105
-
106
-
107
-
108
-
109
-
110
-
111
-
112
-
113
-
114
-
115
-
116
-
117
-
118
-
119
-
120
-
121
-
122
-
123
-
124
-
125
-
126
-
127
-
128
-
129
-
130
-
131
-
132
-
133
-
134
-
135
-
136
-
137
-
138
-
139
-
140
-
141
-
142
-
143
-
144
-
145
-
146
-
147
-
148
-
149
-
150
-
151
-
152
-
153
-
154
-
155
-
156
-
157
-
158
-
159
-
160
-
161
-
162
-
163
-
164
-
165
-
166
-
167
-
168
-
169
-
170
-
171
-
172
-
173
-
174
-
175
-
176
-
177
-
178
-
179
-
180
-
181
-
182
-
183
-
184
-
185
-
186
-
187
-
188
-
189
-
190
-
191
-
192
-
193
-
194
-
195
-
196
-
197
-
198
-
199
-
200
-
201
-
202
-
203
-
204
-
205
-
206
-
207
-
208
-
209
-
210
-
211
-
212
-
213
-
214
-
215
-
216
-
217
-
218
-
219
-
220
-
221
-
222
-
223
-
224
-
225
-
226
-
227
-
228
-
229
-
230
-
231
 |
 |
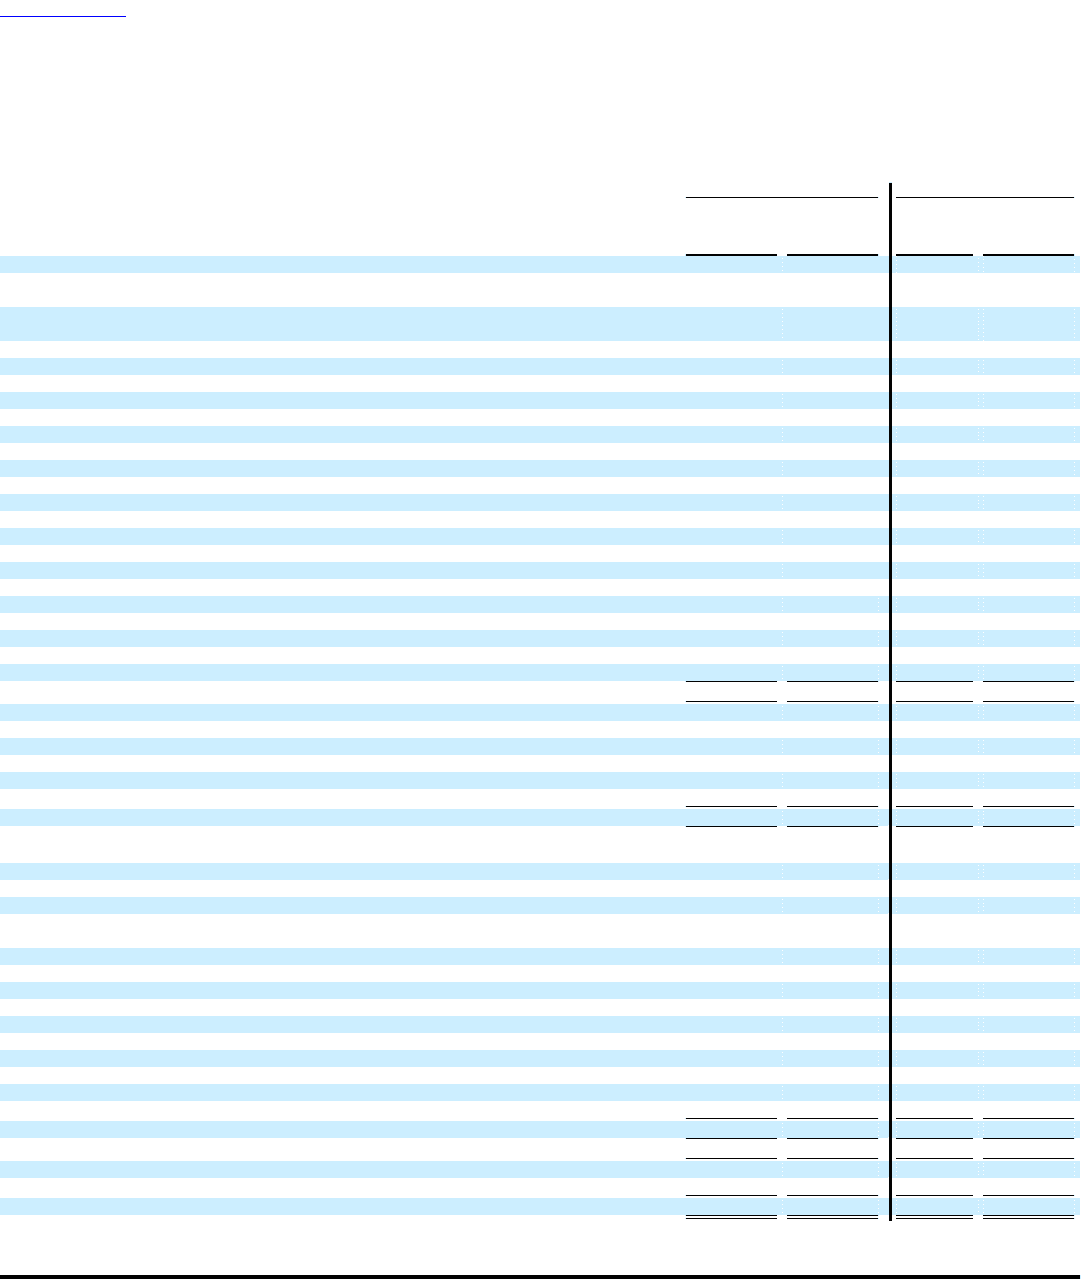
Table of Contents
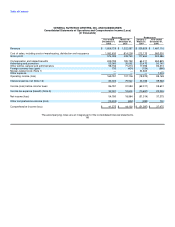
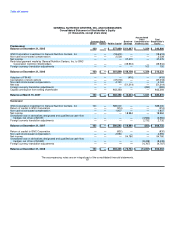
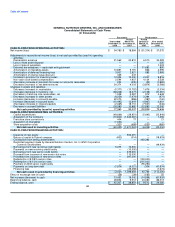
GENERAL NUTRITION CENTERS, INC. AND SUBSIDIARIES
Consolidated Statements of Cash Flows
(in thousands)
Successor Predecessor
Period Period
Year ended March 16- January 1- Year ended
December 31, December 31, March 15, December 31,
2008 2007 2007 2006
CASH FLOWS FROM OPERATING ACTIVITIES:
Net income (loss) $ 54,780 $ 18,984 $ (51,314) $ 37,375
Adjustments to reconcile net income (loss) to net cash provided by (used in) operating
activities:
Depreciation expense 31,562 20,810 6,510 34,583
Loss of fixed asset disposal — — — 220
Loss of sale of subsidiary — — — 1,203
Deferred fee writedown — early debt extinguishment — — 11,680 890
Amortization of intangible assets 10,891 9,191 866 4,595
Amortization of deferred financing fees 3,907 2,921 589 2,966
Amortization of original issue discount 339 247 — —
Increase in provision for inventory losses 14,406 10,400 2,247 9,816
Non-cash stock-based compensation 2,594 1,907 4,124 2,528
(Decrease) increase in provision for losses on accounts receivable 253 (335) (39) (1,982)
Decrease (increase) in net deferred taxes 24,371 9,303 (3,874) (3,588)
Changes in assets and liabilities:
Decrease (increase) in receivables (5,371) (10,752) 1,676 (2,334)
(Increase) decrease in inventory, net (48,248) (6,377) (2,128) (31,261)
Decrease in franchise note receivables, net 1,008 2,587 912 4,649
Decrease (increase) in other assets (6,259) (7,474) 3,394 (471)
Increase (decrease) in accounts payable 22,075 (986) (387) (140)
Increase (decrease) in accrued taxes (10,495) 12,619 (4,967) 2,601
(Decrease) increase in interest payable (2,365) 18,110 (7,531) (346)
Decrease in accrued liabilities (16,083) 10,882 (12,682) 12,342
Net cash provided by (used in) operating activities 77,365 92,037 (50,924) 73,646
CASH FLOWS FROM INVESTING ACTIVITIES:
Capital expenditures (48,666) (28,851) (5,693) (23,846)
Acquisition of the Company (10,842) (1,642,061) — 1,356
Franchise store conversions 404 77 — 21
Acquisition of intangibles (1,000) — — —
Store acquisition costs (321) (489) (555) (965)
Net cash used in investing activities (60,425) (1,671,324) (6,248) (23,434)
CASH FLOWS FROM FINANCING ACTIVITIES:
Issuance of new equity — 552,291 — —
Return of capital to Parent company (832) (314) — (18,618)
Contribution from selling shareholders — — 463,393 —
Restricted payment made by General Nutrition Centers, Inc. to GNC Corporation
Common Stockholders — — — (49,934)
Borrowings from new revolving credit facility 5,375 10,500 — —
Payments on new revolving credit facility — (10,500) — —
Borrowings from new senior credit facility — 675,000 — —
Proceeds from issuance of new senior sub notes — 110,000 — —
Proceeds from issuance of new senior notes — 297,000 — —
Redemption of 8 5/8% senior notes — — (150,000) —
Redemption of 8 1/2% senior notes — — (215,000) —
Payment of 2003 senior credit facility — — (55,290) —
Payments on long-term debt (7,974) (6,021) (334) (41,974)
Financing fees — (29,298) — (1,674)
Net cash (used in) provided by financing activities (3,431) 1,598,658 42,769 (112,200)
Effect of exchange rate on cash (56) (29) (165) 55
Net increase (decrease) in cash 13,453 19,342 (14,568) (61,933)
Beginning balance, cash 28,854 9,512 24,080 86,013
Ending balance, cash $ 42,307 $ 28,854 $ 9,512 $ 24,080
68