GNC 2009 Annual Report Download - page 122
Download and view the complete annual report
Please find page 122 of the 2009 GNC annual report below. You can navigate through the pages in the report by either clicking on the pages listed below, or by using the keyword search tool below to find specific information within the annual report.-
 1
1 -
2
-
3
-
4
-
5
-
6
-
7
-
8
-
9
-
10
-
11
-
12
-
13
-
14
-
15
-
16
-
17
-
18
-
19
-
20
-
21
-
22
-
23
-
24
-
25
-
26
-
27
-
28
-
29
-
30
-
31
-
32
-
33
-
34
-
35
-
36
-
37
-
38
-
39
-
40
-
41
-
42
-
43
-
44
-
45
-
46
-
47
-
48
-
49
-
50
-
51
-
52
-
53
-
54
-
55
-
56
-
57
-
58
-
59
-
60
-
61
-
62
-
63
-
64
-
65
-
66
-
67
-
68
-
69
-
70
-
71
-
72
-
73
-
74
-
75
-
76
-
77
-
78
-
79
-
80
-
81
-
82
-
83
-
84
-
85
-
86
-
87
-
88
-
89
-
90
-
91
-
92
-
93
-
94
-
95
-
96
-
97
-
98
-
99
-
100
-
101
-
102
-
103
-
104
-
105
-
106
-
107
-
108
-
109
-
110
-
111
-
 112
112 -
 113
113 -
 114
114 -
 115
115 -
 116
116 -
 117
117 -
 118
118 -
 119
119 -
 120
120 -
 121
121 -
 122
122 -
 123
123 -
 124
124 -
 125
125 -
 126
126 -
 127
127 -
 128
128 -
 129
129 -
 130
130 -
 131
131 -
 132
132 -
133
-
134
-
135
-
136
-
137
-
138
-
139
-
140
-
141
-
142
-
143
-
144
-
145
-
146
-
147
-
148
-
149
-
150
-
151
-
152
-
153
-
154
-
155
-
156
-
157
-
158
-
159
-
160
-
161
-
162
-
163
-
164
-
165
-
166
-
167
-
168
-
169
-
170
-
171
-
172
-
173
-
174
-
175
-
176
-
177
-
178
-
179
-
180
-
181
-
182
-
183
-
184
-
185
-
186
-
187
-
188
-
189
-
190
-
191
-
192
-
193
-
194
-
195
-
196
-
197
-
198
-
199
-
200
-
201
-
202
-
203
-
204
-
205
-
206
-
207
-
208
-
209
-
210
-
211
-
212
-
213
-
214
-
215
-
216
-
217
-
218
-
219
-
220
-
221
-
222
-
223
-
224
-
225
-
226
-
227
-
228
-
229
-
230
-
231
 |
 |
Table of Contents
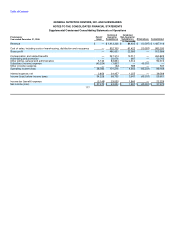
GENERAL NUTRITION CENTERS, INC. AND SUBSIDIARIES
NOTES TO THE CONSOLIDATED FINANCIAL STATEMENTS
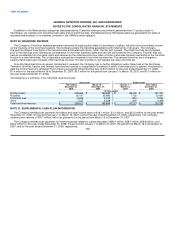
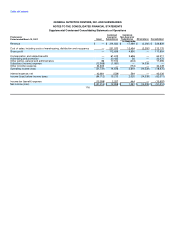
Supplemental Condensed Consolidating Statements of Operations
Combined Combined
Predecessor Guarantor Non-Guarantor
Period ended March 15, 2007 Issuer Subsidiaries Subsidiaries Eliminations Consolidated
(in thousands)
Revenue $ — $ 314,632 $ 17,489 $ (2,292) $ 329,829
Cost of sales, including costs of warehousing, distribution and occupancy — 201,973 12,494 (2,292) 212,175
Gross profit — 112,659 4,995 — 117,654
Compensation and related benefits — 61,615 2,696 — 64,311
Advertising and promotion — 20,435 38 — 20,473
Other selling, general and administrative 86 17,514 (204) — 17,396
Subsidiary (income) expense (12,958) (1,581) — 14,539 —
Other (income) expense 34,603 — (154) — 34,449
Operating income (loss) (21,731) 14,676 2,619 (14,539) (18,975)
Interest expense, net 42,981 (539) 594 — 43,036
Income (loss) before income taxes (64,712) 15,215 2,025 (14,539) (62,011)
Income tax (benefit) expense (13,398) 2,257 444 — (10,697)
Net income (loss) $ (51,314) $ 12,958 $ 1,581 $ (14,539) $ (51,314)
116