GNC 2009 Annual Report Download - page 119
Download and view the complete annual report
Please find page 119 of the 2009 GNC annual report below. You can navigate through the pages in the report by either clicking on the pages listed below, or by using the keyword search tool below to find specific information within the annual report.-
 1
1 -
2
-
3
-
4
-
5
-
6
-
7
-
8
-
9
-
10
-
11
-
12
-
13
-
14
-
15
-
16
-
17
-
18
-
19
-
20
-
21
-
22
-
23
-
24
-
25
-
26
-
27
-
28
-
29
-
30
-
31
-
32
-
33
-
34
-
35
-
36
-
37
-
38
-
39
-
40
-
41
-
42
-
43
-
44
-
45
-
46
-
47
-
48
-
49
-
50
-
51
-
52
-
53
-
54
-
55
-
56
-
57
-
58
-
59
-
60
-
61
-
62
-
63
-
64
-
65
-
66
-
67
-
68
-
69
-
70
-
71
-
72
-
73
-
74
-
75
-
76
-
77
-
78
-
79
-
80
-
81
-
82
-
83
-
84
-
85
-
86
-
87
-
88
-
89
-
90
-
91
-
92
-
93
-
94
-
95
-
96
-
97
-
98
-
99
-
100
-
101
-
102
-
103
-
104
-
105
-
106
-
107
-
108
-
 109
109 -
 110
110 -
 111
111 -
 112
112 -
 113
113 -
 114
114 -
 115
115 -
 116
116 -
 117
117 -
 118
118 -
 119
119 -
 120
120 -
 121
121 -
 122
122 -
 123
123 -
 124
124 -
 125
125 -
 126
126 -
 127
127 -
 128
128 -
 129
129 -
130
-
131
-
132
-
133
-
134
-
135
-
136
-
137
-
138
-
139
-
140
-
141
-
142
-
143
-
144
-
145
-
146
-
147
-
148
-
149
-
150
-
151
-
152
-
153
-
154
-
155
-
156
-
157
-
158
-
159
-
160
-
161
-
162
-
163
-
164
-
165
-
166
-
167
-
168
-
169
-
170
-
171
-
172
-
173
-
174
-
175
-
176
-
177
-
178
-
179
-
180
-
181
-
182
-
183
-
184
-
185
-
186
-
187
-
188
-
189
-
190
-
191
-
192
-
193
-
194
-
195
-
196
-
197
-
198
-
199
-
200
-
201
-
202
-
203
-
204
-
205
-
206
-
207
-
208
-
209
-
210
-
211
-
212
-
213
-
214
-
215
-
216
-
217
-
218
-
219
-
220
-
221
-
222
-
223
-
224
-
225
-
226
-
227
-
228
-
229
-
230
-
231
 |
 |
Table of Contents
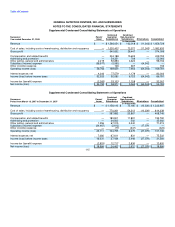
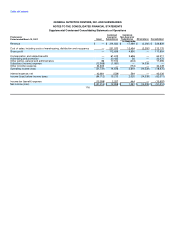
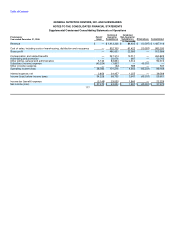
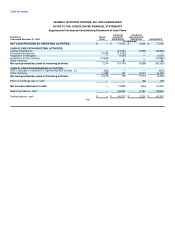
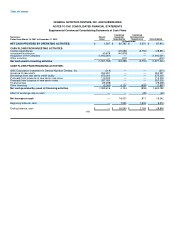
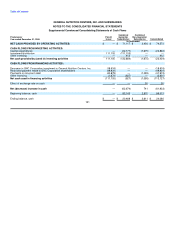
GENERAL NUTRITION CENTERS, INC. AND SUBSIDIARIES
NOTES TO THE CONSOLIDATED FINANCIAL STATEMENTS
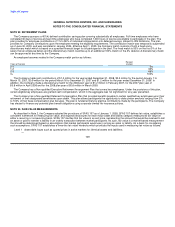
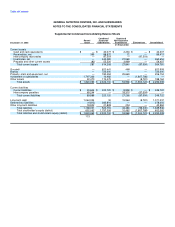
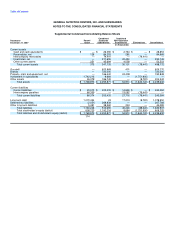
Supplemental Condensed Consolidating Balance Sheets
Combined Combined
Parent/ Guarantor Non-Guarantor
December 31, 2008 Issuer Subsidiaries Subsidiaries Eliminations Consolidated
(in thousands)
Current assets
Cash and cash equivalents $ — $ 40,077 $ 2,230 $ — $ 42,307
Receivables, net 369 88,972 72 — 89,413
Intercompany receivables — 87,554 — (87,554) —
Inventories, net — 342,085 21,569 — 363,654
Prepaids and other current assets (82) 55,520 3,969 — 59,407
Total current assets 287 614,208 27,840 (87,554) 554,781
Goodwill — 622,441 468 — 622,909
Brands — 720,000 — — 720,000
Property, plant and equipment, net — 180,494 25,660 — 206,154
Investment in subsidiaries 1,797,306 10,482 — (1,807,788) —
Other assets 22,470 174,475 — (8,781) 188,164
Total assets $ 1,820,063 $ 2,322,100 $ 53,968 $ (1,904,123) $ 2,292,008
Current liabilities
Current liabilities $ 20,644 $ 220,120 $ 8,958 $ — $ 249,722
Intercompany payables 69,244 — 18,310 (87,554) —
Total current liabilities 89,888 220,120 27,268 (87,554) 249,722
Long-term debt 1,064,024 30 15,964 (8,781) 1,071,237
Deferred tax liabilities (4,813) 282,816 — — 278,003
Other long-term liabilities 18,902 21,828 254 — 40,984
Total liabilities 1,168,001 524,794 43,486 (96,335) 1,639,946
Total stockholder's equity (deficit) 652,062 1,797,306 10,482 (1,807,788) 652,062
Total liabilities and stockholder's equity (deficit) $ 1,820,063 $ 2,322,100 $ 53,968 $ (1,904,123) $ 2,292,008
113