GNC 2009 Annual Report Download - page 67
Download and view the complete annual report
Please find page 67 of the 2009 GNC annual report below. You can navigate through the pages in the report by either clicking on the pages listed below, or by using the keyword search tool below to find specific information within the annual report.-
 1
1 -
2
-
3
-
4
-
5
-
6
-
7
-
8
-
9
-
10
-
11
-
12
-
13
-
14
-
15
-
16
-
17
-
18
-
19
-
20
-
21
-
22
-
23
-
24
-
25
-
26
-
27
-
28
-
29
-
30
-
31
-
32
-
33
-
34
-
35
-
36
-
37
-
38
-
39
-
40
-
41
-
42
-
43
-
44
-
45
-
46
-
47
-
48
-
49
-
50
-
51
-
52
-
53
-
54
-
55
-
56
-
 57
57 -
 58
58 -
 59
59 -
 60
60 -
 61
61 -
 62
62 -
 63
63 -
 64
64 -
 65
65 -
 66
66 -
 67
67 -
 68
68 -
 69
69 -
 70
70 -
 71
71 -
 72
72 -
 73
73 -
 74
74 -
 75
75 -
 76
76 -
 77
77 -
78
-
79
-
80
-
81
-
82
-
83
-
84
-
85
-
86
-
87
-
88
-
89
-
90
-
91
-
92
-
93
-
94
-
95
-
96
-
97
-
98
-
99
-
100
-
101
-
102
-
103
-
104
-
105
-
106
-
107
-
108
-
109
-
110
-
111
-
112
-
113
-
114
-
115
-
116
-
117
-
118
-
119
-
120
-
121
-
122
-
123
-
124
-
125
-
126
-
127
-
128
-
129
-
130
-
131
-
132
-
133
-
134
-
135
-
136
-
137
-
138
-
139
-
140
-
141
-
142
-
143
-
144
-
145
-
146
-
147
-
148
-
149
-
150
-
151
-
152
-
153
-
154
-
155
-
156
-
157
-
158
-
159
-
160
-
161
-
162
-
163
-
164
-
165
-
166
-
167
-
168
-
169
-
170
-
171
-
172
-
173
-
174
-
175
-
176
-
177
-
178
-
179
-
180
-
181
-
182
-
183
-
184
-
185
-
186
-
187
-
188
-
189
-
190
-
191
-
192
-
193
-
194
-
195
-
196
-
197
-
198
-
199
-
200
-
201
-
202
-
203
-
204
-
205
-
206
-
207
-
208
-
209
-
210
-
211
-
212
-
213
-
214
-
215
-
216
-
217
-
218
-
219
-
220
-
221
-
222
-
223
-
224
-
225
-
226
-
227
-
228
-
229
-
230
-
231
 |
 |
Table of Contents
ITEM 7A. QUANTITATIVE AND QUALITATIVE DISCLOSURES ABOUT MARKET RISK.
Market risk represents the risk of changes in the value of market risk sensitive instruments caused by fluctuations in interest rates, foreign
exchange rates and commodity prices. Changes in these factors could cause fluctuations in the results of our operations and cash flows. In the
ordinary course of business, we are primarily exposed to foreign currency and interest rate risks. We do not use derivative financial instruments
in connection with these commodity market risks.
We are exposed to market risks from interest rate changes on our variable debt. Although changes in interest rates do not impact our
operating income the changes affect the fair value of our interest rate swaps and interest payments. As of December 31, 2008, we had fixed
rate debt of $118.6 million and variable rate debt of $966.2 million. In conjunction with the Merger, we entered into an interest rate swap,
effective April 2, 2007, which effectively converts a portion of the variable LIBOR component of the effective interest rate on two $150.0 million
notional portions of our debt under our $675.0 million senior credit facility to a fixed rate over a specified term. Each of these $150.0 million
notional amounts has a three month LIBOR tranche conforming to the interest payment dates on the term loan. During September 2008, we
entered into two new forward agreements with start dates of the expiration dates of the pre-existing interest rate swap agreements (April 2009
and April 2010). During September 2008, we entered into a new interest rate swap agreement with an effective date of September 30, 2008
that effectively converted an additional notional amount of $100.0 million of debt from floating to fixed interest rate. The $100.0 million notional
amount has a three month LIBOR tranche conforming to the interest payment dates on the term loan.
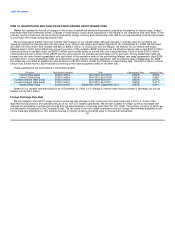
These agreements are summarized in the following table:
Derivative Total Notional Amount Term Counterparty Pays Company Pays
Interest Rate Swap $150.0 million April 2007-April 2010 LIBOR 4.90%
Interest Rate Swap $150.0 million April 2007-April 2009 LIBOR 4.94%
Forward Interest Rate Swap $150.0 million April 2009-April 2011 LIBOR 3.07%
Forward Interest Rate Swap $150.0 million April 2010-April 2011 LIBOR 3.41%
Interest Rate Swap $100.0 million September 2008- September 2011 LIBOR 3.31%
Based on our variable rate debt balance as of December 31, 2008, a 1% change in interest rates would increase or decrease our annual
interest cost by $5.7 million.
Foreign Exchange Rate Risk
We are subject to the risk of foreign currency exchange rate changes in the conversion from local currencies to the U.S. dollar of the
reported financial position and operating results of our non-U.S. based subsidiaries. We are also subject to foreign currency exchange rate
changes for purchases of goods and services that are denominated in currencies other than the U.S. dollar. The primary currency to which we
are exposed to fluctuations is the Canadian Dollar. The fair value of our net foreign investments and our foreign denominated payables would
not be materially affected by a 10% adverse change in foreign currency exchange rates for the periods presented.
61