GNC 2009 Annual Report Download - page 113
Download and view the complete annual report
Please find page 113 of the 2009 GNC annual report below. You can navigate through the pages in the report by either clicking on the pages listed below, or by using the keyword search tool below to find specific information within the annual report.-
 1
1 -
2
-
3
-
4
-
5
-
6
-
7
-
8
-
9
-
10
-
11
-
12
-
13
-
14
-
15
-
16
-
17
-
18
-
19
-
20
-
21
-
22
-
23
-
24
-
25
-
26
-
27
-
28
-
29
-
30
-
31
-
32
-
33
-
34
-
35
-
36
-
37
-
38
-
39
-
40
-
41
-
42
-
43
-
44
-
45
-
46
-
47
-
48
-
49
-
50
-
51
-
52
-
53
-
54
-
55
-
56
-
57
-
58
-
59
-
60
-
61
-
62
-
63
-
64
-
65
-
66
-
67
-
68
-
69
-
70
-
71
-
72
-
73
-
74
-
75
-
76
-
77
-
78
-
79
-
80
-
81
-
82
-
83
-
84
-
85
-
86
-
87
-
88
-
89
-
90
-
91
-
92
-
93
-
94
-
95
-
96
-
97
-
98
-
99
-
100
-
101
-
102
-
 103
103 -
 104
104 -
 105
105 -
 106
106 -
 107
107 -
 108
108 -
 109
109 -
 110
110 -
 111
111 -
 112
112 -
 113
113 -
 114
114 -
 115
115 -
 116
116 -
 117
117 -
 118
118 -
 119
119 -
 120
120 -
 121
121 -
 122
122 -
 123
123 -
124
-
125
-
126
-
127
-
128
-
129
-
130
-
131
-
132
-
133
-
134
-
135
-
136
-
137
-
138
-
139
-
140
-
141
-
142
-
143
-
144
-
145
-
146
-
147
-
148
-
149
-
150
-
151
-
152
-
153
-
154
-
155
-
156
-
157
-
158
-
159
-
160
-
161
-
162
-
163
-
164
-
165
-
166
-
167
-
168
-
169
-
170
-
171
-
172
-
173
-
174
-
175
-
176
-
177
-
178
-
179
-
180
-
181
-
182
-
183
-
184
-
185
-
186
-
187
-
188
-
189
-
190
-
191
-
192
-
193
-
194
-
195
-
196
-
197
-
198
-
199
-
200
-
201
-
202
-
203
-
204
-
205
-
206
-
207
-
208
-
209
-
210
-
211
-
212
-
213
-
214
-
215
-
216
-
217
-
218
-
219
-
220
-
221
-
222
-
223
-
224
-
225
-
226
-
227
-
228
-
229
-
230
-
231
 |
 |

Table of Contents
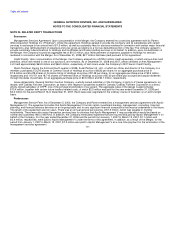
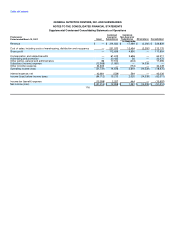
GENERAL NUTRITION CENTERS, INC. AND SUBSIDIARIES
NOTES TO THE CONSOLIDATED FINANCIAL STATEMENTS
Successor Predecessor
Year Ended March 16- January 1- Year Ended
December 31, December 31 March 15, December 31,
2008 2007 2007 2006
(in thousands)
Depreciation and amortization:
Retail $ 21,449 $ 14,806 $ 4,114 $ 22,143
Franchise 5,001 4,025 365 1,837
Manufacturing / Wholesale 9,783 7,014 1,714 8,364
Corporate / Other 6,220 4,156 1,183 6,834
Total depreciation and amortization $ 42,453 $ 30,001 $ 7,376 $ 39,178
Capital expenditures:
Retail $ 33,074 $ 18,347 $ 4,778 $ 15,440
Franchise 7 4 — —
Manufacturing / Wholesale 11,108 6,694 285 5,933
Corporate / Other 4,477 3,806 630 2,473
Total capital expenditures $ 48,666 $ 28,851 $ 5,693 $ 23,846
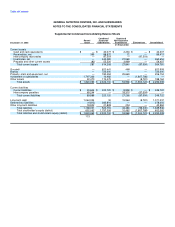
Total assets
Retail $ 1,263,229 $ 1,242,999 $ 472,131 $ 485,153
Franchise 471,247 476,685 273,348 275,530
Manufacturing / Wholesale 436,018 426,250 129,438 133,899
Corporate / Other 121,514 93,698 106,348 74,203
Total assets $ 2,292,008 $ 2,239,632 $ 981,265 $ 968,785
Geographic areas
Total revenues:
United States $ 1,567,641 $ 1,156,806 $ 314,804 $ 1,413,650
Foreign 89,088 66,181 15,025 73,466
Total revenues $ 1,656,729 $ 1,222,987 $ 329,829 $ 1,487,116
Long-lived assets:
United States $ 201,787 $ 189,416 $ 181,617 $ 171,609
Foreign 6,885 6,526 3,323 3,223
Total long-lived assets $ 208,672 $ 195,942 $ 184,940 $ 174,832
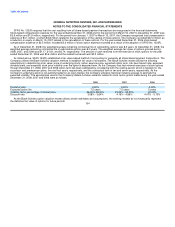
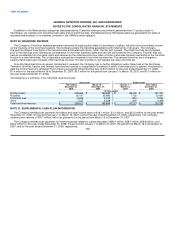
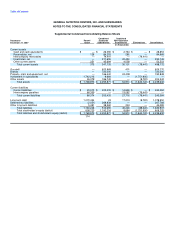
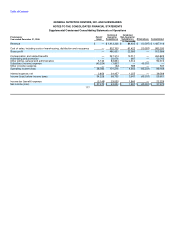
The following table represents sales by general product category. The category "Other" includes other wellness products sales from the
Company's point of sales system and certain required accounting adjustments of $4.7 million for 2008, ($0.6) million for the period from January
1 to March 15, 2007, $5.0 million for the period from March 16 to December 31, 2007, $0.1 million for 2006.
Successor Predecessor
Year ended March 16- January 1- Year ended
December 31, December 31 March 15, December 31,
U.S Retail Product Categories: 2008 2007 2007 2006
(in thousands)
VMHS $ 465,245 $ 342,731 $ 98,447 $ 421,458
Sports Nutrition Products 410,133 299,035 87,983 375,607
Diet and Weight Management Products 148,158 120,099 36,647 161,657
Other Wellness Products 106,681 81,218 21,211 96,186
Total U.S. Retail revenues 1,130,217 843,083 244,288 1,054,908
Canada retail revenues (1) 89,088 66,181 15,025 67,762
Total Retail Revenue $ 1,219,305 $ 909,264 $ 259,313 $ 1,122,670
(1) Product sales for Canada are managed in local currency, therefore the total results are reflected in this table.
107