GNC 2009 Annual Report Download - page 120
Download and view the complete annual report
Please find page 120 of the 2009 GNC annual report below. You can navigate through the pages in the report by either clicking on the pages listed below, or by using the keyword search tool below to find specific information within the annual report.-
 1
1 -
2
-
3
-
4
-
5
-
6
-
7
-
8
-
9
-
10
-
11
-
12
-
13
-
14
-
15
-
16
-
17
-
18
-
19
-
20
-
21
-
22
-
23
-
24
-
25
-
26
-
27
-
28
-
29
-
30
-
31
-
32
-
33
-
34
-
35
-
36
-
37
-
38
-
39
-
40
-
41
-
42
-
43
-
44
-
45
-
46
-
47
-
48
-
49
-
50
-
51
-
52
-
53
-
54
-
55
-
56
-
57
-
58
-
59
-
60
-
61
-
62
-
63
-
64
-
65
-
66
-
67
-
68
-
69
-
70
-
71
-
72
-
73
-
74
-
75
-
76
-
77
-
78
-
79
-
80
-
81
-
82
-
83
-
84
-
85
-
86
-
87
-
88
-
89
-
90
-
91
-
92
-
93
-
94
-
95
-
96
-
97
-
98
-
99
-
100
-
101
-
102
-
103
-
104
-
105
-
106
-
107
-
108
-
109
-
 110
110 -
 111
111 -
 112
112 -
 113
113 -
 114
114 -
 115
115 -
 116
116 -
 117
117 -
 118
118 -
 119
119 -
 120
120 -
 121
121 -
 122
122 -
 123
123 -
 124
124 -
 125
125 -
 126
126 -
 127
127 -
 128
128 -
 129
129 -
 130
130 -
131
-
132
-
133
-
134
-
135
-
136
-
137
-
138
-
139
-
140
-
141
-
142
-
143
-
144
-
145
-
146
-
147
-
148
-
149
-
150
-
151
-
152
-
153
-
154
-
155
-
156
-
157
-
158
-
159
-
160
-
161
-
162
-
163
-
164
-
165
-
166
-
167
-
168
-
169
-
170
-
171
-
172
-
173
-
174
-
175
-
176
-
177
-
178
-
179
-
180
-
181
-
182
-
183
-
184
-
185
-
186
-
187
-
188
-
189
-
190
-
191
-
192
-
193
-
194
-
195
-
196
-
197
-
198
-
199
-
200
-
201
-
202
-
203
-
204
-
205
-
206
-
207
-
208
-
209
-
210
-
211
-
212
-
213
-
214
-
215
-
216
-
217
-
218
-
219
-
220
-
221
-
222
-
223
-
224
-
225
-
226
-
227
-
228
-
229
-
230
-
231
 |
 |
Table of Contents
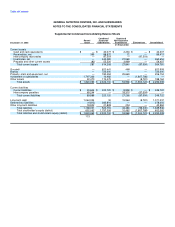
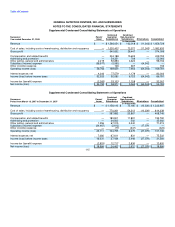
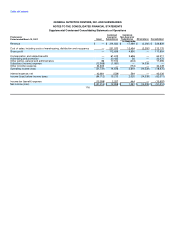
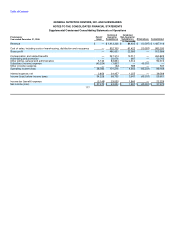
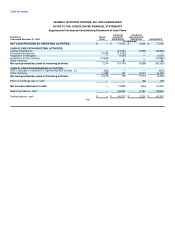
GENERAL NUTRITION CENTERS, INC. AND SUBSIDIARIES
NOTES TO THE CONSOLIDATED FINANCIAL STATEMENTS
Supplemental Condensed Consolidating Balance Sheets
Combined Combined
Successor Parent/ Guarantor Non-Guarantor
December 31, 2007 Issuer Subsidiaries Subsidiaries Eliminations Consolidated
(in thousands)
Current assets
Cash and cash equivalents $ — $ 26,090 $ 2,764 $ — $ 28,854
Receivables, net 128 84,253 285 — 84,666
Intercompany receivables — 79,441 — (79,441) —
Inventories, net — 311,655 22,494 — 334,149
Other current assets 251 45,694 4,558 — 50,503
Total current assets 379 547,133 30,101 (79,441) 498,172
Goodwill — 625,869 401 — 626,270
Brands — 720,000 — — 720,000
Property, plant and equipment, net — 166,440 24,408 — 190,848
Investment in subsidiaries 1,742,216 9,684 — (1,751,900) —
Other assets 26,378 186,745 — (8,781) 204,342
Total assets $ 1,768,973 $ 2,255,871 $ 54,910 $ (1,840,122) $ 2,239,632
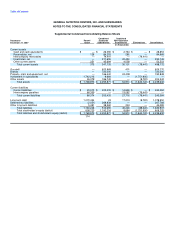
Current liabilities
Current liabilities $ 20,015 $ 205,433 $ 14,636 $ — $ 240,084
Intercompany payables 66,359 — 13,082 (79,441) —
Total current liabilities 86,374 205,433 27,718 (79,441) 240,084
Long-term debt 1,070,434 23 17,274 (8,781) 1,078,950
Deferred tax liabilities (2,051) 269,839 — — 267,788
Other long-term liabilities 5,491 38,360 234 — 44,085
Total liabilities 1,160,248 513,655 45,226 (88,222) 1,630,907
Total stockholder's equity (deficit) 608,725 1,742,216 9,684 (1,751,900) 608,725
Total liabilities and stockholder's equity (deficit) $ 1,768,973 $ 2,255,871 $ 54,910 $ (1,840,122) $ 2,239,632
114