GNC 2009 Annual Report Download - page 110
Download and view the complete annual report
Please find page 110 of the 2009 GNC annual report below. You can navigate through the pages in the report by either clicking on the pages listed below, or by using the keyword search tool below to find specific information within the annual report.-
 1
1 -
2
-
3
-
4
-
5
-
6
-
7
-
8
-
9
-
10
-
11
-
12
-
13
-
14
-
15
-
16
-
17
-
18
-
19
-
20
-
21
-
22
-
23
-
24
-
25
-
26
-
27
-
28
-
29
-
30
-
31
-
32
-
33
-
34
-
35
-
36
-
37
-
38
-
39
-
40
-
41
-
42
-
43
-
44
-
45
-
46
-
47
-
48
-
49
-
50
-
51
-
52
-
53
-
54
-
55
-
56
-
57
-
58
-
59
-
60
-
61
-
62
-
63
-
64
-
65
-
66
-
67
-
68
-
69
-
70
-
71
-
72
-
73
-
74
-
75
-
76
-
77
-
78
-
79
-
80
-
81
-
82
-
83
-
84
-
85
-
86
-
87
-
88
-
89
-
90
-
91
-
92
-
93
-
94
-
95
-
96
-
97
-
98
-
99
-
 100
100 -
 101
101 -
 102
102 -
 103
103 -
 104
104 -
 105
105 -
 106
106 -
 107
107 -
 108
108 -
 109
109 -
 110
110 -
 111
111 -
 112
112 -
 113
113 -
 114
114 -
 115
115 -
 116
116 -
 117
117 -
 118
118 -
 119
119 -
 120
120 -
121
-
122
-
123
-
124
-
125
-
126
-
127
-
128
-
129
-
130
-
131
-
132
-
133
-
134
-
135
-
136
-
137
-
138
-
139
-
140
-
141
-
142
-
143
-
144
-
145
-
146
-
147
-
148
-
149
-
150
-
151
-
152
-
153
-
154
-
155
-
156
-
157
-
158
-
159
-
160
-
161
-
162
-
163
-
164
-
165
-
166
-
167
-
168
-
169
-
170
-
171
-
172
-
173
-
174
-
175
-
176
-
177
-
178
-
179
-
180
-
181
-
182
-
183
-
184
-
185
-
186
-
187
-
188
-
189
-
190
-
191
-
192
-
193
-
194
-
195
-
196
-
197
-
198
-
199
-
200
-
201
-
202
-
203
-
204
-
205
-
206
-
207
-
208
-
209
-
210
-
211
-
212
-
213
-
214
-
215
-
216
-
217
-
218
-
219
-
220
-
221
-
222
-
223
-
224
-
225
-
226
-
227
-
228
-
229
-
230
-
231
 |
 |

Table of Contents
GENERAL NUTRITION CENTERS, INC. AND SUBSIDIARIES
NOTES TO THE CONSOLIDATED FINANCIAL STATEMENTS
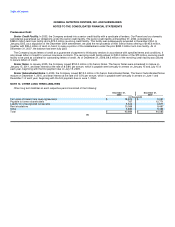
SFAS No. 123(R) requires that the cost resulting from all share-based payment transactions be recognized in the financial statements.
Stock-based compensation expense for the year ended December 31, 2008 and for the period from March 16, 2007 to December 31, 2007 was
$2.6 million and $1.9 million, respectively. For the period from January 1, 2007 to March 15, 2007, the Company recognized total compensation
expense of $4.1 million, of which $3.8 million related to the acceleration of the vesting of these options. The Company recorded $47.0 million as
a reduction in equity on March 15, 2007 related to the cancellation of these options. For the year ended December 31, 2006 stock-based
compensation expense of $2.5 million included $2.3 million of stock option expense recorded as a result of the adoption of SFAS No. 123(R).
As of December 31, 2008, the weighted average remaining contractual life of outstanding options was 8.3 years. At December 31, 2008, the
weighted average remaining contractual life of exercisable options was 8.0 years. The weighted average fair value of options granted during
2008, 2007, and 2006 was $1.17, $1.61, and $3.74, respectively. The amount of cash received from the exercise of stock options for the year
ended December 31, 2006 was $0.6 million and the related tax benefit was $0.2 million.
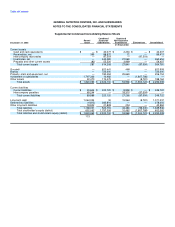
As stated above, SFAS 123(R) established a fair-value-based method of accounting for generally all share-based payment transactions. The
Company utilizes the Black-Scholes valuation method to establish fair value of all awards. The Black-Scholes model utilizes the following
assumptions in determining a fair value: price of underlying stock, option exercise price, expected option term, risk-free interest rate, expected
dividend yield, and expected stock price volatility over the option's expected term. As the Company has had minimal exercises of stock options
through December 31, 2008, 2007 and 2006 option term has been estimated by considering both the vesting period, which is typically for the
successor and predecessor plans, five and four years, respectively, and the contractual term of ten and seven years, respectively. As the
Company's underlying stock is not publicly traded on an open market, the Company utilized a historical industry average to estimate the
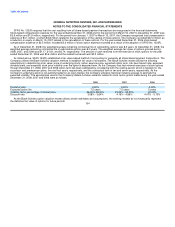
expected volatility. The assumptions used in the Company's Black-Scholes valuation related to stock option grants made during the year ended
December 31, 2008, 2007 and 2006 were as follows:
2008 2007 2006
Dividend yield 0.00% 0.00% 0.00%
Expected option life 7.5 years 7.5 years 5 years
Volatility factor percentage of market price 26.00%-28.40% 23.00% - 25.00% 22.00%
Discount rate 3.08% - 3.64% 4.16% - 4.96% 4.47% - 5.10%
As the Black-Scholes option valuation model utilizes certain estimates and assumptions, the existing models do not necessarily represent
the definitive fair value of options for future periods. 104