GNC 2009 Annual Report Download - page 121
Download and view the complete annual report
Please find page 121 of the 2009 GNC annual report below. You can navigate through the pages in the report by either clicking on the pages listed below, or by using the keyword search tool below to find specific information within the annual report.-
 1
1 -
2
-
3
-
4
-
5
-
6
-
7
-
8
-
9
-
10
-
11
-
12
-
13
-
14
-
15
-
16
-
17
-
18
-
19
-
20
-
21
-
22
-
23
-
24
-
25
-
26
-
27
-
28
-
29
-
30
-
31
-
32
-
33
-
34
-
35
-
36
-
37
-
38
-
39
-
40
-
41
-
42
-
43
-
44
-
45
-
46
-
47
-
48
-
49
-
50
-
51
-
52
-
53
-
54
-
55
-
56
-
57
-
58
-
59
-
60
-
61
-
62
-
63
-
64
-
65
-
66
-
67
-
68
-
69
-
70
-
71
-
72
-
73
-
74
-
75
-
76
-
77
-
78
-
79
-
80
-
81
-
82
-
83
-
84
-
85
-
86
-
87
-
88
-
89
-
90
-
91
-
92
-
93
-
94
-
95
-
96
-
97
-
98
-
99
-
100
-
101
-
102
-
103
-
104
-
105
-
106
-
107
-
108
-
109
-
110
-
 111
111 -
 112
112 -
 113
113 -
 114
114 -
 115
115 -
 116
116 -
 117
117 -
 118
118 -
 119
119 -
 120
120 -
 121
121 -
 122
122 -
 123
123 -
 124
124 -
 125
125 -
 126
126 -
 127
127 -
 128
128 -
 129
129 -
 130
130 -
 131
131 -
132
-
133
-
134
-
135
-
136
-
137
-
138
-
139
-
140
-
141
-
142
-
143
-
144
-
145
-
146
-
147
-
148
-
149
-
150
-
151
-
152
-
153
-
154
-
155
-
156
-
157
-
158
-
159
-
160
-
161
-
162
-
163
-
164
-
165
-
166
-
167
-
168
-
169
-
170
-
171
-
172
-
173
-
174
-
175
-
176
-
177
-
178
-
179
-
180
-
181
-
182
-
183
-
184
-
185
-
186
-
187
-
188
-
189
-
190
-
191
-
192
-
193
-
194
-
195
-
196
-
197
-
198
-
199
-
200
-
201
-
202
-
203
-
204
-
205
-
206
-
207
-
208
-
209
-
210
-
211
-
212
-
213
-
214
-
215
-
216
-
217
-
218
-
219
-
220
-
221
-
222
-
223
-
224
-
225
-
226
-
227
-
228
-
229
-
230
-
231
 |
 |
Table of Contents
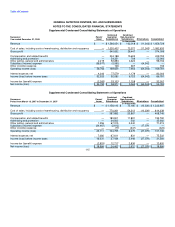
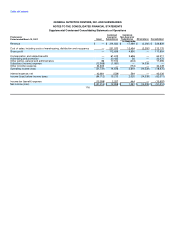
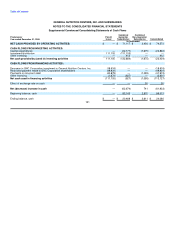
GENERAL NUTRITION CENTERS, INC. AND SUBSIDIARIES
NOTES TO THE CONSOLIDATED FINANCIAL STATEMENTS
Supplemental Condensed Consolidating Statements of Operations
Combined Combined
Successor Parent/ Guarantor Non-Guarantor
Year ended December 31, 2008 Issuer Subsidiaries Subsidiaries Eliminations Consolidated
(in thousands)
Revenue $ — $ 1,566,054 $ 102,018 $ (11,343) $ 1,656,729
Cost of sales, including costs of warehousing, distribution and occupancy — 1,020,402 73,571 (11,343) 1,082,630
Gross profit — 545,652 28,447 — 574,099
Compensation and related benefits — 234,188 15,605 — 249,793
Advertising and promotion — 54,351 709 — 55,060
Other selling, general and administrative 2,215 92,893 3,624 — 98,732
Subsidiary (income) expense (58,977) (5,565) — 64,542 —
Other (income) expense — 126 607 — 733
Operating income (loss) 56,762 169,659 7,902 (64,542) 169,781
Interest expense, net 4,242 77,579 1,179 — 83,000
Income (loss) before income taxes 52,520 92,080 6,723 (64,542) 86,781
Income tax (benefit) expense (2,260) 33,103 1,158 — 32,001
Net income (loss) $ 54,780 $ 58,977 $ 5,565 $ (64,542) $ 54,780
Supplemental Condensed Consolidating Statements of Operations
Combined Combined
Successor Parent/ Guarantor Non-Guarantor
Period from March 16, 2007 to December 31, 2007 Issuer Subsidiaries Subsidiaries Eliminations Consolidated
(in thousands)
Revenue $ — $ 1,158,143 $ 75,180 $ (10,336) $ 1,222,987
Cost of sales, including costs of warehousing, distribution and occupancy — 770,261 54,313 (10,336) 814,238
Gross profit — 387,882 20,867 — 408,749
Compensation and related benefits — 183,901 11,891 — 195,792
Advertising and promotion — 34,560 502 — 35,062
Other selling, general and administrative 1,356 67,315 2,542 — 71,213
Subsidiary (income) expense (24,467) (2,612) — 27,079 —
Other (income) expense — (77) (347) — (424)
Operating income (loss) 23,111 104,795 6,279 (27,079) 107,106
Interest expense, net 7,080 67,611 831 — 75,522
Income (loss) before income taxes 16,031 37,184 5,448 (27,079) 31,584
Income tax (benefit) expense (2,953) 12,717 2,836 — 12,600
Net income (loss) $ 18,984 $ 24,467 $ 2,612 $ (27,079) $ 18,984
115