GNC 2009 Annual Report Download - page 114
Download and view the complete annual report
Please find page 114 of the 2009 GNC annual report below. You can navigate through the pages in the report by either clicking on the pages listed below, or by using the keyword search tool below to find specific information within the annual report.-
 1
1 -
2
-
3
-
4
-
5
-
6
-
7
-
8
-
9
-
10
-
11
-
12
-
13
-
14
-
15
-
16
-
17
-
18
-
19
-
20
-
21
-
22
-
23
-
24
-
25
-
26
-
27
-
28
-
29
-
30
-
31
-
32
-
33
-
34
-
35
-
36
-
37
-
38
-
39
-
40
-
41
-
42
-
43
-
44
-
45
-
46
-
47
-
48
-
49
-
50
-
51
-
52
-
53
-
54
-
55
-
56
-
57
-
58
-
59
-
60
-
61
-
62
-
63
-
64
-
65
-
66
-
67
-
68
-
69
-
70
-
71
-
72
-
73
-
74
-
75
-
76
-
77
-
78
-
79
-
80
-
81
-
82
-
83
-
84
-
85
-
86
-
87
-
88
-
89
-
90
-
91
-
92
-
93
-
94
-
95
-
96
-
97
-
98
-
99
-
100
-
101
-
102
-
103
-
 104
104 -
 105
105 -
 106
106 -
 107
107 -
 108
108 -
 109
109 -
 110
110 -
 111
111 -
 112
112 -
 113
113 -
 114
114 -
 115
115 -
 116
116 -
 117
117 -
 118
118 -
 119
119 -
 120
120 -
 121
121 -
 122
122 -
 123
123 -
 124
124 -
125
-
126
-
127
-
128
-
129
-
130
-
131
-
132
-
133
-
134
-
135
-
136
-
137
-
138
-
139
-
140
-
141
-
142
-
143
-
144
-
145
-
146
-
147
-
148
-
149
-
150
-
151
-
152
-
153
-
154
-
155
-
156
-
157
-
158
-
159
-
160
-
161
-
162
-
163
-
164
-
165
-
166
-
167
-
168
-
169
-
170
-
171
-
172
-
173
-
174
-
175
-
176
-
177
-
178
-
179
-
180
-
181
-
182
-
183
-
184
-
185
-
186
-
187
-
188
-
189
-
190
-
191
-
192
-
193
-
194
-
195
-
196
-
197
-
198
-
199
-
200
-
201
-
202
-
203
-
204
-
205
-
206
-
207
-
208
-
209
-
210
-
211
-
212
-
213
-
214
-
215
-
216
-
217
-
218
-
219
-
220
-
221
-
222
-
223
-
224
-
225
-
226
-
227
-
228
-
229
-
230
-
231
 |
 |

Table of Contents
GENERAL NUTRITION CENTERS, INC. AND SUBSIDIARIES
NOTES TO THE CONSOLIDATED FINANCIAL STATEMENTS
In addition to the Retail product categories discussed above, Franchise revenues are primarily generated from (1) product sales to
franchisees, (2) royalties from franchise retail sales and (3) franchise fees, and Manufacturing/ Wholesale sales are generated from sales of
manufactured products to third parties, primarily in the VMHS product category.
NOTE 20. FRANCHISE REVENUE
The Company's Franchise segment generates revenues through product sales to franchisees, royalties, franchise fees and interest income
on the financing of the franchise locations. The Company enters into franchise agreements with initial terms of ten years. The Company
charges franchisees three types of flat franchise fees associated with stores: initial, transfer and renewal. The initial franchise fee is payable
prior to the franchise store opening as consideration for the initial franchise rights and services performed by the Company. Transfer fees are
paid as consideration for the same rights and services as the initial fee and occur when a former franchisee transfers ownership of the franchise
location to a new franchisee. This is typically a reduced fee compared to the initial franchise fee. The renewal franchise fee is charged to
existing franchisees upon renewal of the franchise contract. This fee is similar to, but typically less than the initial fee.
Once the franchised store is opened, transferred or renewed, the Company has no further obligations under these fees to the franchisee.
Therefore, all initial, transfer and renewal franchise fee revenue is recognized in the period in which a franchise store is opened, transferred or
date the contract period is renewed. The Company recognized initial franchise fees of $3.3 million for the year ended December 31, 2008,
$1.4 million for the period March 16 to December 31, 2007, $0.3 million for the period from January 1 to March 15, 2007, and $1.5 million for
the year ended December 31, 2006.
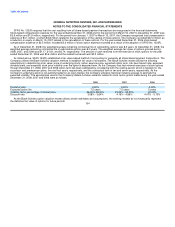
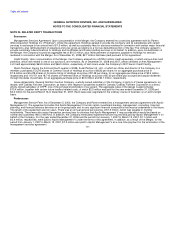
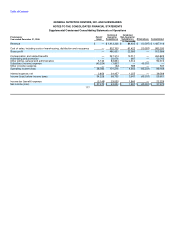
The following is a summary of our franchise revenue by type:
Successor Predecessor
Year Ended March 16 — January 1 — Year ended
December 31, December 31, March 15, December 31,
2008 2007 2007 2006
(in thousands)
Product sales $ 209,662 $ 160,665 $ 38,409 $ 191,707
Royalties 35,147 25,990 7,102 32,641
Franchise fees 5,676 3,013 810 3,532
Other 7,535 4,228 916 4,409
Total franchise revenue $ 258,020 $ 193,896 $ 47,237 $ 232,289
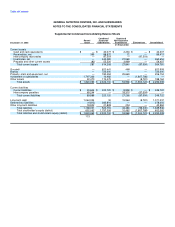
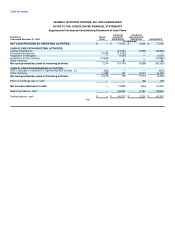
NOTE 21. SUPPLEMENTAL CASH FLOW INFORMATION
The Company remitted cash payments for federal and state income taxes of $18.1 million, $1.2 million, and $23.2 million for the year ended
December 31, 2008, for the period January 1 to March 15, 2007, and for the year ended December 31, 2006, respectively. The Company
received cash refunds of $19.7 million, net of tax payments for the period from March 16 to December 31, 2007.
The Company remitted cash payments for interest expense related to outstanding debt of $80.1 million, $38.7 million, $56.8 million, and
$40.2 million for the year ended December 31, 2008, the period from January 1 to March 15, 2007, the period from March 16 to December 31,
2007, and for the year ended December 31, 2006, respectively. 108