GNC 2009 Annual Report Download - page 49
Download and view the complete annual report
Please find page 49 of the 2009 GNC annual report below. You can navigate through the pages in the report by either clicking on the pages listed below, or by using the keyword search tool below to find specific information within the annual report.-
 1
1 -
2
-
3
-
4
-
5
-
6
-
7
-
8
-
9
-
10
-
11
-
12
-
13
-
14
-
15
-
16
-
17
-
18
-
19
-
20
-
21
-
22
-
23
-
24
-
25
-
26
-
27
-
28
-
29
-
30
-
31
-
32
-
33
-
34
-
35
-
36
-
37
-
38
-
 39
39 -
 40
40 -
 41
41 -
 42
42 -
 43
43 -
 44
44 -
 45
45 -
 46
46 -
 47
47 -
 48
48 -
 49
49 -
 50
50 -
 51
51 -
 52
52 -
 53
53 -
 54
54 -
 55
55 -
 56
56 -
 57
57 -
 58
58 -
 59
59 -
60
-
61
-
62
-
63
-
64
-
65
-
66
-
67
-
68
-
69
-
70
-
71
-
72
-
73
-
74
-
75
-
76
-
77
-
78
-
79
-
80
-
81
-
82
-
83
-
84
-
85
-
86
-
87
-
88
-
89
-
90
-
91
-
92
-
93
-
94
-
95
-
96
-
97
-
98
-
99
-
100
-
101
-
102
-
103
-
104
-
105
-
106
-
107
-
108
-
109
-
110
-
111
-
112
-
113
-
114
-
115
-
116
-
117
-
118
-
119
-
120
-
121
-
122
-
123
-
124
-
125
-
126
-
127
-
128
-
129
-
130
-
131
-
132
-
133
-
134
-
135
-
136
-
137
-
138
-
139
-
140
-
141
-
142
-
143
-
144
-
145
-
146
-
147
-
148
-
149
-
150
-
151
-
152
-
153
-
154
-
155
-
156
-
157
-
158
-
159
-
160
-
161
-
162
-
163
-
164
-
165
-
166
-
167
-
168
-
169
-
170
-
171
-
172
-
173
-
174
-
175
-
176
-
177
-
178
-
179
-
180
-
181
-
182
-
183
-
184
-
185
-
186
-
187
-
188
-
189
-
190
-
191
-
192
-
193
-
194
-
195
-
196
-
197
-
198
-
199
-
200
-
201
-
202
-
203
-
204
-
205
-
206
-
207
-
208
-
209
-
210
-
211
-
212
-
213
-
214
-
215
-
216
-
217
-
218
-
219
-
220
-
221
-
222
-
223
-
224
-
225
-
226
-
227
-
228
-
229
-
230
-
231
 |
 |

Table of Contents
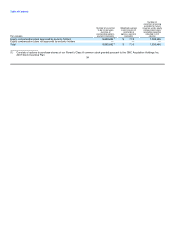
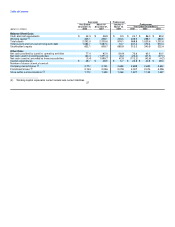
Results of Operations
(Dollars in millions and percentages expressed as a percentage of total net revenues)
Successor
Successor Combined Predecessor March 16 - Predecessor
Year Ended December 31, Year Ended December 31, January 1 - March 15, December 31, Year Ended December 31,
2008 2007 2007 2007 2006
Revenues:
Retail $ 1,219.3 73.6% $ 1,168.6 75.3% $ 259.3 78.6% $ 909.3 74.3% $ 1,122.7 75.5%
Franchise 258.0 15.6% 241.1 15.5% 47.2 14.3% 193.9 15.9% 232.3 15.6%
Manufacturing / Wholesale 179.4 10.8% 143.1 9.2% 23.3 7.1% 119.8 9.8% 132.1 8.9%
Total net revenues 1,656.7 100.0% 1,552.8 100.0% 329.8 100.0% 1,223.0 100.0% 1,487.1 100.0%
Operating expenses:
Cost of sales, including warehousing, distribution
and occupancy costs 1,082.6 65.3% 1,026.4 66.1% 212.2 64.4% 814.2 66.5% 983.5 66.1%
Compensation and related benefits 249.8 15.1% 260.1 16.7% 64.3 19.5% 195.8 16.0% 260.8 17.5%
Advertising and promotion 55.1 3.3% 55.5 3.6% 20.5 6.2% 35.0 2.9% 50.7 3.4%
Other selling, general and administrative
expenses 87.8 5.3% 78.6 5.1% 16.5 5.0% 62.1 5.1% 87.8 6.0%
Amortization expense 10.9 0.7% 10.0 0.6% 0.8 0.2% 9.2 0.7% 4.6 0.3%
Foreign currency loss (gain) 0.7 0.0% (0.5) 0.0% (0.1) 0.0% (0.4) 0.0% (0.7) 0.0%
Other expense — 0.0% — 0.0% — 0.0% — 0.0% 1.2 0.0%
Merger-related costs — 0.0% 34.6 2.2% 34.6 10.5% — 0.0% — 0.0%
Total operating expenses 1,486.9 89.7% 1,464.7 94.3% 348.8 105.8% 1,115.9 91.2% 1,387.9 93.3%
Operating income:
Retail 140.9 8.5% 134.7 8.7% 28.2 8.6% 106.5 8.8% 127.4 8.6%
Franchise 80.8 4.9% 69.5 4.5% 14.5 4.4% 55.0 4.5% 64.1 4.3%
Manufacturing / Wholesale 67.4 4.1% 49.2 3.1% 10.3 3.1% 38.9 3.2% 51.0 3.4%
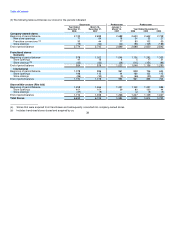
Unallocated corporate and other costs:
Warehousing and distribution costs (54.2) -3.3% (51.4) -3.3% (10.7) -3.2% (40.7) -3.3% (50.7) -3.4%
Corporate costs (65.1) -3.9% (79.3) -5.1% (26.7) -8.2% (52.6) -4.4% (91.4) -6.2%
Merger related costs — 0.0% (34.6) -2.2% (34.6) -10.5% — 0.0% — 0.0%
Other (expense) income — 0.0% — 0.0% — 0.0% — 0.0% (1.2) 0.0%
Subtotal unallocated corporate and other costs,
net (119.3) -7.2% (165.3) -10.6% (72.0) -21.9% (93.3) -7.7% (143.3) -9.6%
Total operating income (loss) 169.8 10.3% 88.1 5.7% (19.0) -5.8% 107.1 8.8% 99.2 6.7%
Interest expense, net 83.0 118.5 43.0 75.5 39.6
Income (loss) before income taxes 86.8 (30.4) (62.0) 31.6 59.6
Income tax expense (benefit) 32.0 1.9 (10.7) 12.6 22.2
Net income (loss) $ 54.8 $ (32.3) $ (51.3) $ 19.0 $ 37.4
Note: The numbers in the above table have been rounded to millions. All calculations related to the Results of Operations for the year-over-
year comparisons below were derived from unrounded data and could occasionally differ immaterially if you were to use the table above for
these calculations. 43