GNC 2009 Annual Report Download - page 112
Download and view the complete annual report
Please find page 112 of the 2009 GNC annual report below. You can navigate through the pages in the report by either clicking on the pages listed below, or by using the keyword search tool below to find specific information within the annual report.-
 1
1 -
2
-
3
-
4
-
5
-
6
-
7
-
8
-
9
-
10
-
11
-
12
-
13
-
14
-
15
-
16
-
17
-
18
-
19
-
20
-
21
-
22
-
23
-
24
-
25
-
26
-
27
-
28
-
29
-
30
-
31
-
32
-
33
-
34
-
35
-
36
-
37
-
38
-
39
-
40
-
41
-
42
-
43
-
44
-
45
-
46
-
47
-
48
-
49
-
50
-
51
-
52
-
53
-
54
-
55
-
56
-
57
-
58
-
59
-
60
-
61
-
62
-
63
-
64
-
65
-
66
-
67
-
68
-
69
-
70
-
71
-
72
-
73
-
74
-
75
-
76
-
77
-
78
-
79
-
80
-
81
-
82
-
83
-
84
-
85
-
86
-
87
-
88
-
89
-
90
-
91
-
92
-
93
-
94
-
95
-
96
-
97
-
98
-
99
-
100
-
101
-
 102
102 -
 103
103 -
 104
104 -
 105
105 -
 106
106 -
 107
107 -
 108
108 -
 109
109 -
 110
110 -
 111
111 -
 112
112 -
 113
113 -
 114
114 -
 115
115 -
 116
116 -
 117
117 -
 118
118 -
 119
119 -
 120
120 -
 121
121 -
 122
122 -
123
-
124
-
125
-
126
-
127
-
128
-
129
-
130
-
131
-
132
-
133
-
134
-
135
-
136
-
137
-
138
-
139
-
140
-
141
-
142
-
143
-
144
-
145
-
146
-
147
-
148
-
149
-
150
-
151
-
152
-
153
-
154
-
155
-
156
-
157
-
158
-
159
-
160
-
161
-
162
-
163
-
164
-
165
-
166
-
167
-
168
-
169
-
170
-
171
-
172
-
173
-
174
-
175
-
176
-
177
-
178
-
179
-
180
-
181
-
182
-
183
-
184
-
185
-
186
-
187
-
188
-
189
-
190
-
191
-
192
-
193
-
194
-
195
-
196
-
197
-
198
-
199
-
200
-
201
-
202
-
203
-
204
-
205
-
206
-
207
-
208
-
209
-
210
-
211
-
212
-
213
-
214
-
215
-
216
-
217
-
218
-
219
-
220
-
221
-
222
-
223
-
224
-
225
-
226
-
227
-
228
-
229
-
230
-
231
 |
 |
Table of Contents
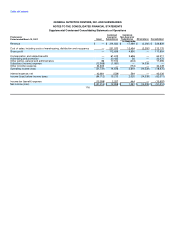
GENERAL NUTRITION CENTERS, INC. AND SUBSIDIARIES
NOTES TO THE CONSOLIDATED FINANCIAL STATEMENTS
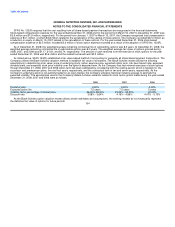
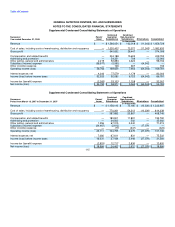
The following table represents key financial information of the Company's business segments:
Successor Predecessor
Year Ended March 16- January 1- Year Ended
December 31, December 31 March 15, December 31,
2008 2007 2007 2006
(in thousands)
Revenue:
Retail $ 1,219,305 $ 909,264 $259,313 $ 1,122,670
Franchise 258,020 193,896 47,237 232,289
Manufacturing/Wholesale:
Intersegment (1) 180,070 133,051 35,477 170,310
Third Party 179,404 119,827 23,279 132,157
Sub total Manufacturing/Wholesale 359,474 252,878 58,756 302,467
Sub total segment revenues 1,836,799 1,356,038 365,306 1,657,426
Intersegment elimination (1) (180,070) (133,051) (35,477) (170,310)
Total revenue $ 1,656,729 $ 1,222,987 $329,829 $ 1,487,116
(1) Intersegment revenues are eliminated from consolidated revenue.
Operating income (loss):
Retail $ 140,916 $ 106,448 $ 28,249 $ 127,444
Franchise 80,816 55,000 14,518 64,060
Manufacturing/Wholesale 67,378 38,915 10,267 51,040
Unallocated corporate and other costs:
Warehousing and distribution costs (54,266) (40,697) (10,667) (50,706)
Corporate costs (65,063) (52,560) (26,739) (91,466)
Merger-related costs — — (34,603) —
Other expense — — — (1,203)
Sub total unallocated corporate and
other costs (119,329) (93,257) (72,009) (143,375)
Total operating income (loss) 169,781 107,106 (18,975) 99,169
Interest expense, net 83,000 75,522 43,036 39,568
Income before income taxes 86,781 31,584 (62,011) 59,601
Income tax expense 32,001 12,600 (10,697) 22,226
Net income $ 54,780 $ 18,984 $ (51,314) $ 37,375
106