GNC 2009 Annual Report Download - page 13
Download and view the complete annual report
Please find page 13 of the 2009 GNC annual report below. You can navigate through the pages in the report by either clicking on the pages listed below, or by using the keyword search tool below to find specific information within the annual report.-
 1
1 -
2
-
 3
3 -
 4
4 -
 5
5 -
 6
6 -
 7
7 -
 8
8 -
 9
9 -
 10
10 -
 11
11 -
 12
12 -
 13
13 -
 14
14 -
 15
15 -
 16
16 -
 17
17 -
 18
18 -
 19
19 -
 20
20 -
 21
21 -
 22
22 -
 23
23 -
24
-
25
-
26
-
27
-
28
-
29
-
30
-
31
-
32
-
33
-
34
-
35
-
36
-
37
-
38
-
39
-
40
-
41
-
42
-
43
-
44
-
45
-
46
-
47
-
48
-
49
-
50
-
51
-
52
-
53
-
54
-
55
-
56
-
57
-
58
-
59
-
60
-
61
-
62
-
63
-
64
-
65
-
66
-
67
-
68
-
69
-
70
-
71
-
72
-
73
-
74
-
75
-
76
-
77
-
78
-
79
-
80
-
81
-
82
-
83
-
84
-
85
-
86
-
87
-
88
-
89
-
90
-
91
-
92
-
93
-
94
-
95
-
96
-
97
-
98
-
99
-
100
-
101
-
102
-
103
-
104
-
105
-
106
-
107
-
108
-
109
-
110
-
111
-
112
-
113
-
114
-
115
-
116
-
117
-
118
-
119
-
120
-
121
-
122
-
123
-
124
-
125
-
126
-
127
-
128
-
129
-
130
-
131
-
132
-
133
-
134
-
135
-
136
-
137
-
138
-
139
-
140
-
141
-
142
-
143
-
144
-
145
-
146
-
147
-
148
-
149
-
150
-
151
-
152
-
153
-
154
-
155
-
156
-
157
-
158
-
159
-
160
-
161
-
162
-
163
-
164
-
165
-
166
-
167
-
168
-
169
-
170
-
171
-
172
-
173
-
174
-
175
-
176
-
177
-
178
-
179
-
180
-
181
-
182
-
183
-
184
-
185
-
186
-
187
-
188
-
189
-
190
-
191
-
192
-
193
-
194
-
195
-
196
-
197
-
198
-
199
-
200
-
201
-
202
-
203
-
204
-
205
-
206
-
207
-
208
-
209
-
210
-
211
-
212
-
213
-
214
-
215
-
216
-
217
-
218
-
219
-
220
-
221
-
222
-
223
-
224
-
225
-
226
-
227
-
228
-
229
-
230
-
231
 |
 |
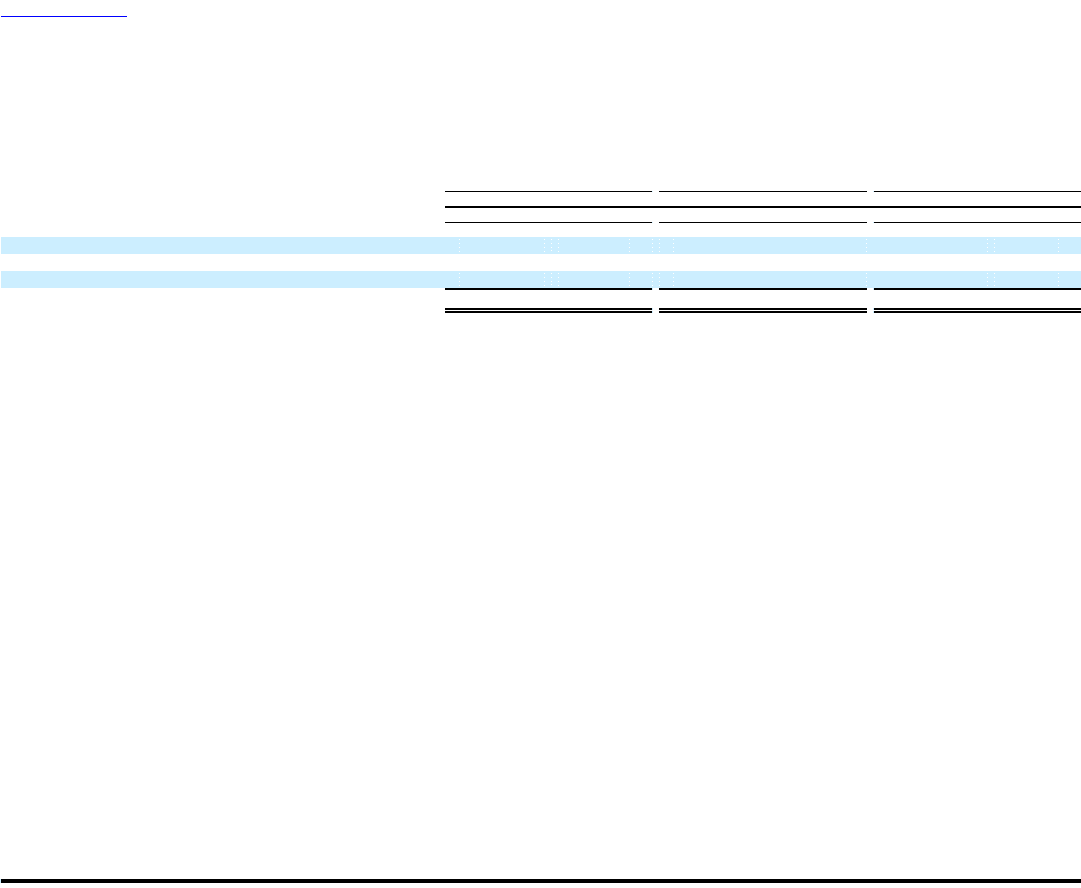
Table of Contents
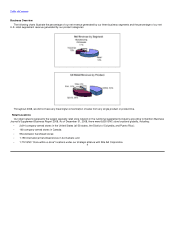
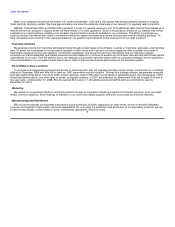
Business Segments
We generate revenues from our three business segments, Retail, Franchise, and Manufacturing/Wholesale. The following chart outlines our
business segments and the historical contribution to our consolidated revenues by those segments, after intercompany eliminations. For a
description of operating income (loss) by business segment, our total assets by business segment, total revenues by geographic area, and total
assets by geographic area, see the "Segments" note to our consolidated financial statements included in this report.
Successor Combined Predecessor
Year ended December 31,
2008 2007 2006
(dollars in millions)
Retail $ 1,219.3 73.6% $ 1,168.6 75.3% $ 1,122.7 75.5%
Franchise 258.0 15.6% 241.1 15.5% 232.3 15.6%
Manufacturing/Wholesale (Third Party) 179.4 10.8% 143.1 9.2% 132.1 8.9%
Total $ 1,656.7 100.0% $ 1,552.8 100.0% $ 1,487.1 100.0%
Retail
Our Retail segment generates revenues primarily from sales of products to customers at our company-owned stores in the United States
and Canada, and through our website, www.gnc.com.
Locations
As of December 31, 2008, we operated 2,774 company-owned stores across all 50 states and in Canada, Puerto Rico, and Washington,
D.C. Most of our U.S. company-owned stores are between 1,000 and 2,000 square feet and are located primarily in shopping malls and strip
shopping centers. Traditional shopping mall and strip shopping center locations typically generate a large percentage of our total retail sales.
With the exception of our downtown stores, virtually all of our company-owned stores follow one of two consistent formats, one for mall
locations and one for strip shopping center locations. Our store graphics are periodically redesigned to better identify with our GNC customers
and provide product information to allow the consumer to make educated decisions regarding product purchases and usage. Our product
labeling is consistent within our product lines and the stores are designed to present a unified approach to packaging with emphasis on added
information for the consumer. As an ongoing practice, we continue to reset and upgrade all of our company-owned stores to maintain a more
modern and customer-friendly layout, while promoting our GNC Live Well theme.
Franchise
Our Franchise segment is comprised of our domestic and international franchise operations. Our Franchise segment generates revenues
from franchise activities primarily through product sales to franchisees, royalties on franchise retail sales, and franchise fees.
As a means of enhancing our operating performance and building our store base, we began opening franchised locations in 1988. As of
December 31, 2008, there were 2,144 franchised stores operating, including 954 stores in the United States and 1,190 stores operating in 44
international locations. Approximately 89% of our franchised stores in the United States are in strip shopping centers and are typically between
1,000 and 2,000 square feet. The international franchised stores are typically smaller and, depending upon the country and cultural
preferences, are located in mall, strip center, street, or store-within-a-store locations. In addition, some international franchisees sell on the
internet in their respective countries. Typically, our international stores have a store format and signage similar to our U.S. franchised stores. To
assist our franchisees in the successful operation of their stores and to protect
8