GNC 2009 Annual Report Download - page 136
Download and view the complete annual report
Please find page 136 of the 2009 GNC annual report below. You can navigate through the pages in the report by either clicking on the pages listed below, or by using the keyword search tool below to find specific information within the annual report.-
 1
1 -
2
-
3
-
4
-
5
-
6
-
7
-
8
-
9
-
10
-
11
-
12
-
13
-
14
-
15
-
16
-
17
-
18
-
19
-
20
-
21
-
22
-
23
-
24
-
25
-
26
-
27
-
28
-
29
-
30
-
31
-
32
-
33
-
34
-
35
-
36
-
37
-
38
-
39
-
40
-
41
-
42
-
43
-
44
-
45
-
46
-
47
-
48
-
49
-
50
-
51
-
52
-
53
-
54
-
55
-
56
-
57
-
58
-
59
-
60
-
61
-
62
-
63
-
64
-
65
-
66
-
67
-
68
-
69
-
70
-
71
-
72
-
73
-
74
-
75
-
76
-
77
-
78
-
79
-
80
-
81
-
82
-
83
-
84
-
85
-
86
-
87
-
88
-
89
-
90
-
91
-
92
-
93
-
94
-
95
-
96
-
97
-
98
-
99
-
100
-
101
-
102
-
103
-
104
-
105
-
106
-
107
-
108
-
109
-
110
-
111
-
112
-
113
-
114
-
115
-
116
-
117
-
118
-
119
-
120
-
121
-
122
-
123
-
124
-
125
-
 126
126 -
 127
127 -
 128
128 -
 129
129 -
 130
130 -
 131
131 -
 132
132 -
 133
133 -
 134
134 -
 135
135 -
 136
136 -
 137
137 -
 138
138 -
 139
139 -
 140
140 -
 141
141 -
 142
142 -
 143
143 -
 144
144 -
 145
145 -
 146
146 -
147
-
148
-
149
-
150
-
151
-
152
-
153
-
154
-
155
-
156
-
157
-
158
-
159
-
160
-
161
-
162
-
163
-
164
-
165
-
166
-
167
-
168
-
169
-
170
-
171
-
172
-
173
-
174
-
175
-
176
-
177
-
178
-
179
-
180
-
181
-
182
-
183
-
184
-
185
-
186
-
187
-
188
-
189
-
190
-
191
-
192
-
193
-
194
-
195
-
196
-
197
-
198
-
199
-
200
-
201
-
202
-
203
-
204
-
205
-
206
-
207
-
208
-
209
-
210
-
211
-
212
-
213
-
214
-
215
-
216
-
217
-
218
-
219
-
220
-
221
-
222
-
223
-
224
-
225
-
226
-
227
-
228
-
229
-
230
-
231
 |
 |

Table of Contents
How We Chose Amounts and/or Formulas for Each Element
Base Salary. The Compensation Committee intends to set the base salary for our Named Executive Officers at a level to attract and retain a
strong motivated leadership team, but not so high that it creates a negative perception with our employees generally, noteholders or
stockholders. Each Named Executive Officer's current and prior compensation is considered in setting future compensation. In addition, we
review the compensation practices of other companies. Base salary amounts are determined by complexity and level of position as well as
market comparisons.
Each year, we perform a market analysis with respect to the compensation of all of our Named Executive Officers. Although we do not use
compensation consultants, we participate in various surveys and use the survey data for market comparisons. Currently, we use surveys with
both base salary and other short-term compensation data, including incentive compensation and fringe benefits, that are available from Mercer
Human Resource Consulting LLC, Western Management Group, and Watson Wyatt Worldwide in the specialty retail and non-durable
manufacturing categories. In addition to focusing our analysis on the specific executive positions, we break down the survey information based
on corporate and/or average store revenue and geographic location of comparable companies to ensure that we are using valid comparisons.
We also use internal value comparisons; however, we do not have any specific point system or rating structure for internal values.
Annual Incentive Compensation. Our Named Executive Officers are entitled to annual performance bonuses pursuant to the terms of their
employment agreements. The annual performance bonus for each Named Executive Officer has target and maximum bonus amounts
expressed as a percentage of his or her annual base salary. The respective percentages are determined by position and level of responsibility
and are stated in the annual incentive plan adopted by the Compensation Committee. The employment agreements of our Chief Executive
Officer and President provide that their targets will not be less than 75% of their respective base salaries with a maximum of 125% of their
respective base salaries. The target and/or maximum amounts may be increased for any Named Executive Officer by the terms of an
employment agreement entered into after the adoption of an annual incentive plan.
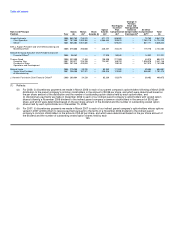
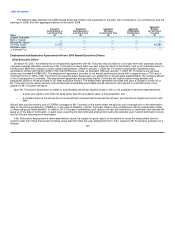
The following table sets forth the target and maximum bonus amounts for each level of executive officer with respect to the 2009 incentive
plan adopted in February 2009 (the "2009 Incentive Plan"), the 2008 incentive plan adopted in February 2008 (the "2008 Incentive Plan") and
the 2007 incentive plan adopted in June 2007 (which replaced and superseded the 2007 incentive plan adopted in December 2006) (the "2007
Incentive Plan"):
2009 Incentive Plan 2008 Incentive Plan 2007 Incentive Plan
Target Maximum Target Maximum Target Maximum
Level Amount Amount Amount Amount Amount Amount
CEO 75% 125% 75% 125% 75% 125%
President 75% 125% 75% 125% — —
Executive Vice President 45% 100% 45% 100% 45% 100%
Senior Vice President 40% 75% 40% 75% 40% 75%
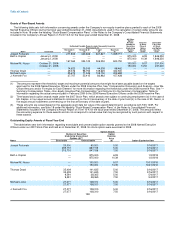
Each annual incentive plan establishes thresholds, expressed as a percentage of the target amount or the maximum amount, based on the
achievement of certain financial performance goals. The target bonus is designed to provide Named Executive Officers with a normal target
bonus if we perform to expectation. The threshold bonus is designed to provide Named Executive Officers with some bonus opportunity, but
less than the target opportunity if we do not achieve our expected budgeted performance. If we exceed our budgeted performance, Named
Executive Officers will be paid a maximum bonus in excess of the target in order to reward them for our outstanding performance. For 2007 and
2008, the goal is based on budgeted EBITDA subject to certain adjustment for non-recurring items as determined by the Company Board. The
following table sets forth the thresholds and related goals with respect to both the 2007 Incentive Plan and the 2008 Incentive Plan:
130