GNC 2009 Annual Report Download - page 42
Download and view the complete annual report
Please find page 42 of the 2009 GNC annual report below. You can navigate through the pages in the report by either clicking on the pages listed below, or by using the keyword search tool below to find specific information within the annual report.-
 1
1 -
2
-
3
-
4
-
5
-
6
-
7
-
8
-
9
-
10
-
11
-
12
-
13
-
14
-
15
-
16
-
17
-
18
-
19
-
20
-
21
-
22
-
23
-
24
-
25
-
26
-
27
-
28
-
29
-
30
-
31
-
 32
32 -
 33
33 -
 34
34 -
 35
35 -
 36
36 -
 37
37 -
 38
38 -
 39
39 -
 40
40 -
 41
41 -
 42
42 -
 43
43 -
 44
44 -
 45
45 -
 46
46 -
 47
47 -
 48
48 -
 49
49 -
 50
50 -
 51
51 -
 52
52 -
53
-
54
-
55
-
56
-
57
-
58
-
59
-
60
-
61
-
62
-
63
-
64
-
65
-
66
-
67
-
68
-
69
-
70
-
71
-
72
-
73
-
74
-
75
-
76
-
77
-
78
-
79
-
80
-
81
-
82
-
83
-
84
-
85
-
86
-
87
-
88
-
89
-
90
-
91
-
92
-
93
-
94
-
95
-
96
-
97
-
98
-
99
-
100
-
101
-
102
-
103
-
104
-
105
-
106
-
107
-
108
-
109
-
110
-
111
-
112
-
113
-
114
-
115
-
116
-
117
-
118
-
119
-
120
-
121
-
122
-
123
-
124
-
125
-
126
-
127
-
128
-
129
-
130
-
131
-
132
-
133
-
134
-
135
-
136
-
137
-
138
-
139
-
140
-
141
-
142
-
143
-
144
-
145
-
146
-
147
-
148
-
149
-
150
-
151
-
152
-
153
-
154
-
155
-
156
-
157
-
158
-
159
-
160
-
161
-
162
-
163
-
164
-
165
-
166
-
167
-
168
-
169
-
170
-
171
-
172
-
173
-
174
-
175
-
176
-
177
-
178
-
179
-
180
-
181
-
182
-
183
-
184
-
185
-
186
-
187
-
188
-
189
-
190
-
191
-
192
-
193
-
194
-
195
-
196
-
197
-
198
-
199
-
200
-
201
-
202
-
203
-
204
-
205
-
206
-
207
-
208
-
209
-
210
-
211
-
212
-
213
-
214
-
215
-
216
-
217
-
218
-
219
-
220
-
221
-
222
-
223
-
224
-
225
-
226
-
227
-
228
-
229
-
230
-
231
 |
 |
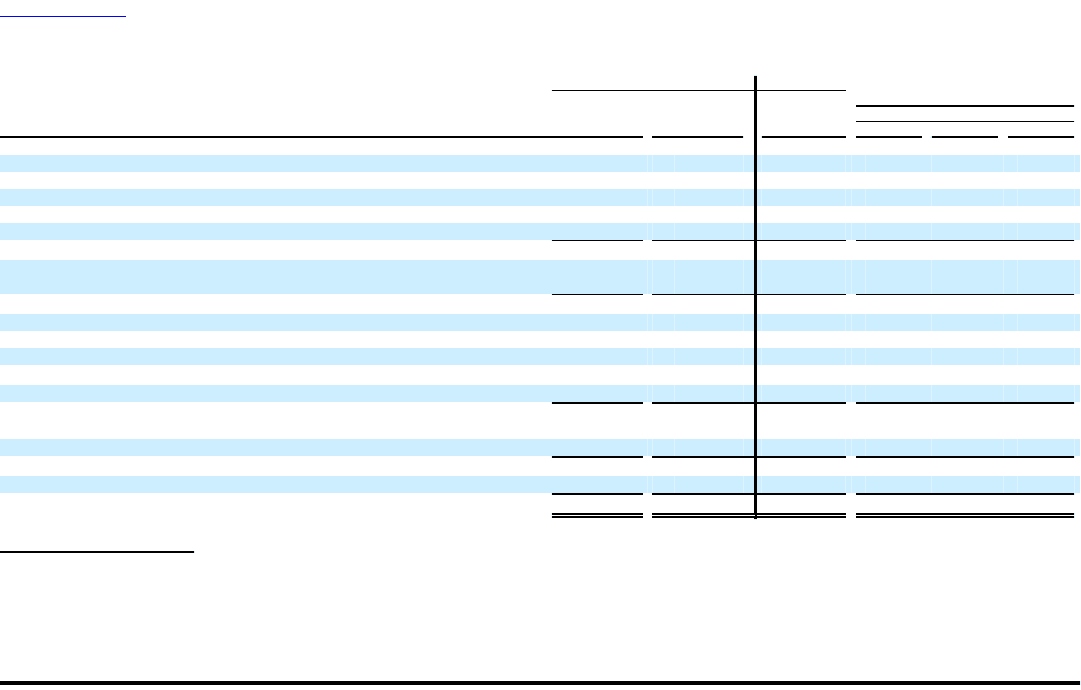
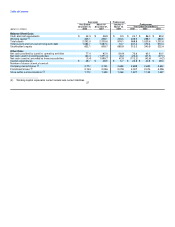
Table of Contents
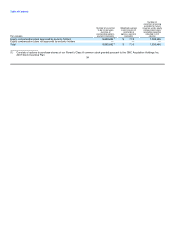
Successor Predecessor
Year Ended March 16- January 1- Predecessor
December 31, December 31, March 15, Year Ended December 31,
(dollars in millions) 2008 2007 2007 2006 2005 2004
Statement of Operations Data:
Revenue:
Retail $ 1,219.3 $ 909.3 $ 259.3 $1,122.7 $ 989.4 $1,001.8
Franchising 258.0 193.9 47.2 232.3 212.8 226.5
Manufacturing/Wholesale 179.4 119.8 23.3 132.1 115.5 116.4
Total revenue 1,656.7 1,223.0 329.8 1,487.1 1,317.7 1,344.7
Cost of sales, including costs of warehousing, distribution and
occupancy 1,082.6 814.2 212.2 983.5 898.7 895.2
Gross profit 574.1 408.8 117.6 503.6 419.0 449.5
Compensation and related benefits 249.8 195.8 64.3 260.8 228.6 230.0
Advertising and promotion 55.1 35.0 20.5 50.7 44.7 44.0
Other selling, general and administrative 98.7 71.3 17.3 92.4 76.2 73.7
Other expense/(income) (1) 0.7 (0.4) (0.1) 0.5 (3.1) (0.3)
Merger related costs. — — 34.6 — — —
Operating income (loss) 169.8 107.1 (19.0) 99.2 72.6 102.1
Interest expense, net 83.0 75.5 43.0 39.6 43.1 34.4
Income (loss) before income taxes 86.8 31.6 (62.0) 59.6 29.5 67.7
Income tax expense (benefit) 32.0 12.6 (10.7) 22.2 10.9 25.1
Net income/ (loss) $ 54.8 $ 19.0 $ (51.3) $ 37.4 $ 18.6 $ 42.6
(1) Other (expense) income includes foreign currency (gain) loss for all of the periods presented. Other expense (income) for the year ended
December 31, 2006 included $1.2 million loss on the sale of our Australian manufacturing facility. Other expense (income) for the year
ended December 31, 2005 included $2.5 million transaction fee income related to the transfer of our GNC Australian franchise rights to an
existing franchisee. 36