GNC 2009 Annual Report Download - page 46
Download and view the complete annual report
Please find page 46 of the 2009 GNC annual report below. You can navigate through the pages in the report by either clicking on the pages listed below, or by using the keyword search tool below to find specific information within the annual report.-
 1
1 -
2
-
3
-
4
-
5
-
6
-
7
-
8
-
9
-
10
-
11
-
12
-
13
-
14
-
15
-
16
-
17
-
18
-
19
-
20
-
21
-
22
-
23
-
24
-
25
-
26
-
27
-
28
-
29
-
30
-
31
-
32
-
33
-
34
-
35
-
 36
36 -
 37
37 -
 38
38 -
 39
39 -
 40
40 -
 41
41 -
 42
42 -
 43
43 -
 44
44 -
 45
45 -
 46
46 -
 47
47 -
 48
48 -
 49
49 -
 50
50 -
 51
51 -
 52
52 -
 53
53 -
 54
54 -
 55
55 -
 56
56 -
57
-
58
-
59
-
60
-
61
-
62
-
63
-
64
-
65
-
66
-
67
-
68
-
69
-
70
-
71
-
72
-
73
-
74
-
75
-
76
-
77
-
78
-
79
-
80
-
81
-
82
-
83
-
84
-
85
-
86
-
87
-
88
-
89
-
90
-
91
-
92
-
93
-
94
-
95
-
96
-
97
-
98
-
99
-
100
-
101
-
102
-
103
-
104
-
105
-
106
-
107
-
108
-
109
-
110
-
111
-
112
-
113
-
114
-
115
-
116
-
117
-
118
-
119
-
120
-
121
-
122
-
123
-
124
-
125
-
126
-
127
-
128
-
129
-
130
-
131
-
132
-
133
-
134
-
135
-
136
-
137
-
138
-
139
-
140
-
141
-
142
-
143
-
144
-
145
-
146
-
147
-
148
-
149
-
150
-
151
-
152
-
153
-
154
-
155
-
156
-
157
-
158
-
159
-
160
-
161
-
162
-
163
-
164
-
165
-
166
-
167
-
168
-
169
-
170
-
171
-
172
-
173
-
174
-
175
-
176
-
177
-
178
-
179
-
180
-
181
-
182
-
183
-
184
-
185
-
186
-
187
-
188
-
189
-
190
-
191
-
192
-
193
-
194
-
195
-
196
-
197
-
198
-
199
-
200
-
201
-
202
-
203
-
204
-
205
-
206
-
207
-
208
-
209
-
210
-
211
-
212
-
213
-
214
-
215
-
216
-
217
-
218
-
219
-
220
-
221
-
222
-
223
-
224
-
225
-
226
-
227
-
228
-
229
-
230
-
231
 |
 |

Table of Contents
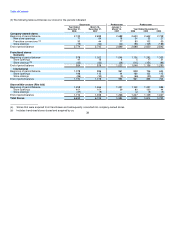
manufacturing and wholesale operations are subject to our available manufacturing capacity, and we anticipate that these revenues
will remain stable over the next five years.
• A significant portion of our business infrastructure is comprised of fixed operating costs. Our vertically integrated distribution network
and manufacturing capacity can support higher sales volume without adding significant incremental costs. We therefore expect our
operating expenses to grow at a lesser rate than our revenues, resulting in significant operating leverage in our business.
The following trends and uncertainties in our industry could positively or negatively affect our operating performance:
• broader consumer awareness of health and wellness issues and rising healthcare costs;
• interest in, and demand for, condition-specific products based on scientific research;
• significant effects of favorable and unfavorable publicity on consumer demand;
• lack of a single product or group of products dominating any one product category;
• volatility in the diet category;
• rapidly evolving consumer preferences and demand for new products;
• costs associated with complying with new and existing governmental regulation; and
• a change in disposable income available to consumers, as a result of current economic conditions.
Executive Overview
The combined results of the fiscal years ended 2006 through 2008 reflect the results of strategies we implemented in 2005 to reposition our
business. These strategic initiatives focused on improving parts of our core retail fundamentals, unifying our corporate and franchise operating
systems, and implementing strategies to take advantage of key assets of our business, primarily the strength of our brand. By doing this, we
hoped to achieve a better overall, consistent shopping experience for our customer.
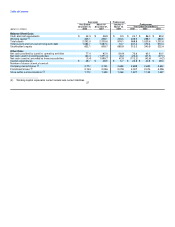
Our recent results of operations reflect the positive results of these initiatives. In the retail segment, for the years ended December 31, 2008,
2007 and 2006, our domestic same store sales increased 2.7%, 1.4%, and 11.1%, respectively. Additionally, since we launched our web
platform in 2005, we have seen continual growth in revenue in our e-commerce business, which contributes to our domestic same store
increases. For the years ended December 31, 2008 and 2007, revenue grew 27.2% and 65.0%, respectively.
Our domestic franchise business is now in line with our corporate operating standards, and key performance indicators of our domestic
franchise stores are more in line with our corporate store results. We continue to see growth in sales of our GNC brand products, which has
helped to strengthen the franchise system. Our international franchise system also has continued to grow and strengthen our presence globally,
with the addition of 112 net new locations in 2008, with no capital funding requirement by us.
Our manufacturing strategy was designed to increase our position in the contract manufacturing business, and maximize utilization of our
available capacity to allow for greater production efficiencies of all products and to help offset any raw material price increases that occur.
Under this strategy, our contract manufacturing sales grew 38.7% in 2008. Further growth in this area, however, will be tempered by capacity
constraints. 40