GNC 2009 Annual Report Download - page 227
Download and view the complete annual report
Please find page 227 of the 2009 GNC annual report below. You can navigate through the pages in the report by either clicking on the pages listed below, or by using the keyword search tool below to find specific information within the annual report.-
 1
1 -
2
-
3
-
4
-
5
-
6
-
7
-
8
-
9
-
10
-
11
-
12
-
13
-
14
-
15
-
16
-
17
-
18
-
19
-
20
-
21
-
22
-
23
-
24
-
25
-
26
-
27
-
28
-
29
-
30
-
31
-
32
-
33
-
34
-
35
-
36
-
37
-
38
-
39
-
40
-
41
-
42
-
43
-
44
-
45
-
46
-
47
-
48
-
49
-
50
-
51
-
52
-
53
-
54
-
55
-
56
-
57
-
58
-
59
-
60
-
61
-
62
-
63
-
64
-
65
-
66
-
67
-
68
-
69
-
70
-
71
-
72
-
73
-
74
-
75
-
76
-
77
-
78
-
79
-
80
-
81
-
82
-
83
-
84
-
85
-
86
-
87
-
88
-
89
-
90
-
91
-
92
-
93
-
94
-
95
-
96
-
97
-
98
-
99
-
100
-
101
-
102
-
103
-
104
-
105
-
106
-
107
-
108
-
109
-
110
-
111
-
112
-
113
-
114
-
115
-
116
-
117
-
118
-
119
-
120
-
121
-
122
-
123
-
124
-
125
-
126
-
127
-
128
-
129
-
130
-
131
-
132
-
133
-
134
-
135
-
136
-
137
-
138
-
139
-
140
-
141
-
142
-
143
-
144
-
145
-
146
-
147
-
148
-
149
-
150
-
151
-
152
-
153
-
154
-
155
-
156
-
157
-
158
-
159
-
160
-
161
-
162
-
163
-
164
-
165
-
166
-
167
-
168
-
169
-
170
-
171
-
172
-
173
-
174
-
175
-
176
-
177
-
178
-
179
-
180
-
181
-
182
-
183
-
184
-
185
-
186
-
187
-
188
-
189
-
190
-
191
-
192
-
193
-
194
-
195
-
196
-
197
-
198
-
199
-
200
-
201
-
202
-
203
-
204
-
205
-
206
-
207
-
208
-
209
-
210
-
211
-
212
-
213
-
214
-
215
-
216
-
 217
217 -
 218
218 -
 219
219 -
 220
220 -
 221
221 -
 222
222 -
 223
223 -
 224
224 -
 225
225 -
 226
226 -
 227
227 -
 228
228 -
 229
229 -
 230
230 -
 231
231
 |
 |
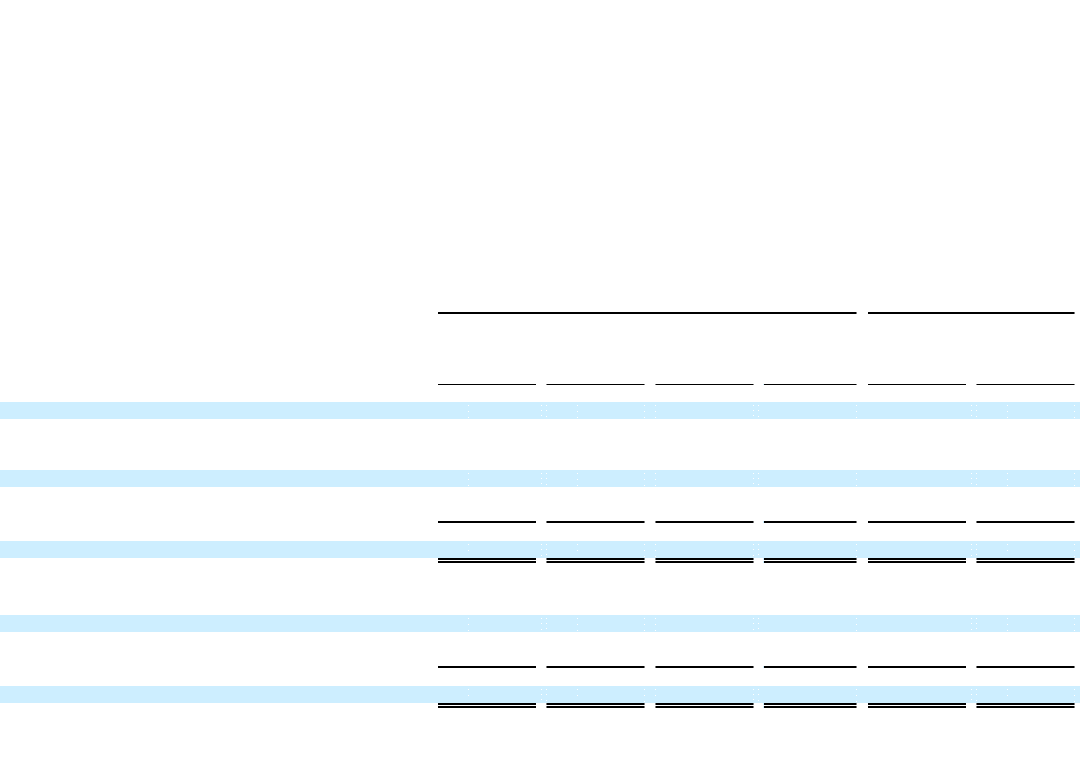
Exhibit 12.1
RATIO OF EARNINGS TO FIXED CHARGES
The following table shows the ratio of earnings to fixed charges for the years ended December 31, 2004, 2005 and 2006, the period from
January 1, 2007 to March 15, 2007, the period from March 16, 2007 to December 31, 2007 and the year ended December 31, 2008. We have
computed these ratios by dividing earnings available for fixed charges (income before income taxes and fixed charges) by fixed charges
(interest cost, amortization of debt expense, and the portion of rental expenses deemed to be representative of the interest factor in those
rentals.)
Computation of General Nutrition Centers, Inc. Ratio of Earnings to Fixed Charges
(Dollars in millions, except ratios)
Predecessor Successor
Period from
March 16,
Year Ended Year Ended Year Ended Period ended 2007 to Year Ended
December 31, December 31, December 31, March 15, December 31, December 31,
2004 2005 2006 2007 2007 2008
Earnings (deficit) available for fixed charges:
Income (deficit) before income taxes $ 67.7 $ 29.5 $ 59.6 $ (62.0) $ 31.6 $ 86.8
Interest Expense 35.5 41.6 43.7 8.5 78.2 84.2
Estimated interest component of net rental expense 36.7 36.8 38.0 8.1 31.4 41.2
Earnings available for fixed charges $ 139.9 $ 107.9 $ 141.3 $ (45.4) $ 141.2 $ 212.2
Fixed Charges:
Interest Expense $ 35.5 $ 41.6 $ 43.7 $ 8.5 $ 78.2 $ 84.2
Estimated interest component of net rental expense 36.7 36.8 38.0 8.1 31.4 41.2
Total fixed charges $ 72.2 $ 78.4 $ 81.7 $ 16.6 $ 109.6 $ 125.4
Consolidated Ratio of Earnings to Fixed Charges 1.94 1.38 1.73 — 1.29 1.69
(1) Earnings were insufficient to cover fixed charges for the period ended March 15, 2007 by $61.9 million.