GNC 2009 Annual Report Download - page 53
Download and view the complete annual report
Please find page 53 of the 2009 GNC annual report below. You can navigate through the pages in the report by either clicking on the pages listed below, or by using the keyword search tool below to find specific information within the annual report.-
 1
1 -
2
-
3
-
4
-
5
-
6
-
7
-
8
-
9
-
10
-
11
-
12
-
13
-
14
-
15
-
16
-
17
-
18
-
19
-
20
-
21
-
22
-
23
-
24
-
25
-
26
-
27
-
28
-
29
-
30
-
31
-
32
-
33
-
34
-
35
-
36
-
37
-
38
-
39
-
40
-
41
-
42
-
 43
43 -
 44
44 -
 45
45 -
 46
46 -
 47
47 -
 48
48 -
 49
49 -
 50
50 -
 51
51 -
 52
52 -
 53
53 -
 54
54 -
 55
55 -
 56
56 -
 57
57 -
 58
58 -
 59
59 -
 60
60 -
 61
61 -
 62
62 -
 63
63 -
64
-
65
-
66
-
67
-
68
-
69
-
70
-
71
-
72
-
73
-
74
-
75
-
76
-
77
-
78
-
79
-
80
-
81
-
82
-
83
-
84
-
85
-
86
-
87
-
88
-
89
-
90
-
91
-
92
-
93
-
94
-
95
-
96
-
97
-
98
-
99
-
100
-
101
-
102
-
103
-
104
-
105
-
106
-
107
-
108
-
109
-
110
-
111
-
112
-
113
-
114
-
115
-
116
-
117
-
118
-
119
-
120
-
121
-
122
-
123
-
124
-
125
-
126
-
127
-
128
-
129
-
130
-
131
-
132
-
133
-
134
-
135
-
136
-
137
-
138
-
139
-
140
-
141
-
142
-
143
-
144
-
145
-
146
-
147
-
148
-
149
-
150
-
151
-
152
-
153
-
154
-
155
-
156
-
157
-
158
-
159
-
160
-
161
-
162
-
163
-
164
-
165
-
166
-
167
-
168
-
169
-
170
-
171
-
172
-
173
-
174
-
175
-
176
-
177
-
178
-
179
-
180
-
181
-
182
-
183
-
184
-
185
-
186
-
187
-
188
-
189
-
190
-
191
-
192
-
193
-
194
-
195
-
196
-
197
-
198
-
199
-
200
-
201
-
202
-
203
-
204
-
205
-
206
-
207
-
208
-
209
-
210
-
211
-
212
-
213
-
214
-
215
-
216
-
217
-
218
-
219
-
220
-
221
-
222
-
223
-
224
-
225
-
226
-
227
-
228
-
229
-
230
-
231
 |
 |

Table of Contents
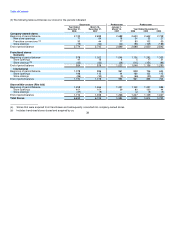
Interest Expense
Interest expense decreased $35.5 million, or 30.0%, to $83.0 million for the year ended December 31, 2008 compared to $118.5 million for
the same period in 2007. This decrease was primarily attributable to $34.8 million in call premiums and deferred fee write offs in 2007 and
decreases in interest rates on our variable rate debt in 2008 as compared to 2007 due to the decline in LIBOR rates.
Income Tax Expense
We recognized $32.0 million of consolidated income tax expense during the year ended December 31, 2008 compared to $1.9 million for the
same period of 2007. The effective tax rate for the year ended December 31, 2008, was approximately 36.9%; which includes discrete tax
benefits of $2.0 million.
Net Income
As a result of the foregoing, consolidated net income increased $87.1 million to $54.8 million for the year ended December 31, 2008
compared to a loss of $32.3 million for the same period in 2007. Net income as a percentage of net revenue was 3.3% for the year ended
December 31, 2008, compared to (2.1)% for the year ended December 31, 2007.
Comparison of the Years Ended December 31, 2007 and 2006
Revenues
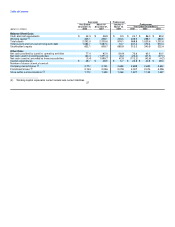
Our consolidated net revenues increased $65.7 million, or 4.4%, to $1,552.8 million for the year ended December 31, 2007 compared to
$1,487.1 million for the same period in 2006. The increase was the result of increased same store sales in our Retail segment, increased
product sales in our Franchise segment, and increased revenue in our Manufacturing/Wholesale segment.
Retail. Revenues in our Retail segment increased $45.9 million, or 4.1%, to $1,168.6 million for the year ended December 31, 2007
compared to $1,122.7 million for the same period in 2006. Included as part of the revenue increase was $28.3 million in revenue for sales
through www.gnc.com compared to $17.1 million in 2006. In 2007, our domestic company-owned same store sales improved by 1.4% and our
Canadian company-owned stores improved by 8.5% for the same period. Our company-owned store base increased by 44 stores to 2,598
domestically, and our Canadian store base increased by 13 stores to 147 at December 31, 2007.
Franchise. Revenues in our Franchise segment increased $8.8 million, or 3.8%, to $241.1 million for the year ended December 31, 2007
compared to $232.3 million for the same period in 2006. This increase is due to increases in our international franchise revenue of $11.3 million
as a result of higher product sales and royalties, offset by a $2.4 million decrease in domestic franchise revenue, the result of operating 68
fewer domestic franchise stores in the year ended December 31, 2007 compared to the same period in 2006. There were 978 domestic
franchise stores at December 31, 2007 compared to 1,046 at December 31, 2006. Our international franchise store base increased by 117
stores to 1,078 at December 31, 2007 compared to 961 at December 31, 2006.
Manufacturing/Wholesale. Revenues in our Manufacturing/Wholesale segment, which includes third-party sales from our manufacturing
facility in South Carolina, as well as wholesale sales to Rite Aid and www.drugstore.com, increased $11.0 million, or 8.3%, to $143.1 million for
the year ended December 31, 2007 compared to $132.1 million for the same period in 2006. Wholesale sales to Rite Aid and
www.drugstore.com increased by $12.3 million, primarily a result of 131 net store-within-a-store openings in 2007. Sales in the South Carolina
plant increased by $4.3 million, as available capacity in the plant was utilized for third party contracts. Additionally, we had $5.7 million in sales
in the year ended December 31, 2006 from our Australia facility, which was sold in November 2006.
47