Dollar General 2013 Annual Report Download - page 97
Download and view the complete annual report
Please find page 97 of the 2013 Dollar General annual report below. You can navigate through the pages in the report by either clicking on the pages listed below, or by using the keyword search tool below to find specific information within the annual report.-
 1
1 -
2
-
3
-
4
-
5
-
6
-
7
-
8
-
9
-
10
-
11
-
12
-
13
-
14
-
15
-
16
-
17
-
18
-
19
-
20
-
21
-
22
-
23
-
24
-
25
-
26
-
27
-
28
-
29
-
30
-
31
-
32
-
33
-
34
-
35
-
36
-
37
-
38
-
39
-
40
-
41
-
42
-
43
-
44
-
45
-
46
-
47
-
48
-
49
-
50
-
51
-
52
-
53
-
54
-
55
-
56
-
57
-
58
-
59
-
60
-
61
-
62
-
63
-
64
-
65
-
66
-
67
-
68
-
69
-
70
-
71
-
72
-
73
-
74
-
75
-
76
-
77
-
78
-
79
-
80
-
81
-
82
-
83
-
84
-
85
-
86
-
 87
87 -
 88
88 -
 89
89 -
 90
90 -
 91
91 -
 92
92 -
 93
93 -
 94
94 -
 95
95 -
 96
96 -
 97
97 -
 98
98 -
 99
99 -
 100
100 -
 101
101 -
 102
102 -
 103
103 -
 104
104 -
 105
105 -
 106
106 -
 107
107 -
108
-
109
-
110
-
111
-
112
-
113
-
114
-
115
-
116
-
117
-
118
-
119
-
120
-
121
-
122
-
123
-
124
-
125
-
126
-
127
-
128
-
129
-
130
-
131
-
132
-
133
-
134
-
135
-
136
-
137
-
138
-
139
-
140
-
141
-
142
-
143
-
144
-
145
-
146
-
147
-
148
-
149
-
150
-
151
-
152
-
153
-
154
-
155
-
156
-
157
-
158
-
159
-
160
-
161
-
162
-
163
-
164
-
165
-
166
-
167
-
168
-
169
-
170
-
171
-
172
-
173
-
174
-
175
-
176
-
177
-
178
-
179
-
180
-
181
-
182
 |
 |

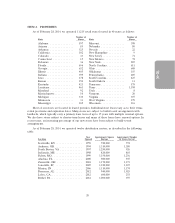
ITEM 2. PROPERTIES
As of February 28, 2014, we operated 11,215 retail stores located in 40 states as follows:
Number of Number of
State Stores State Stores
Alabama ............... 597 Missouri ................ 398
Arizona ................ 85 Nebraska ............... 80
Arkansas ............... 325 Nevada ................ 22
California ............... 102 New Hampshire .......... 9
Colorado ............... 33 New Jersey .............. 71
Connecticut ............. 15 New Mexico ............. 72
Delaware ............... 36 New York ............... 285
Florida ................. 656 North Carolina ........... 611
Georgia ................ 632 Ohio .................. 608
Illinois ................. 405 Oklahoma .............. 355
Indiana ................ 399 Pennsylvania ............. 489
Iowa .................. 178 South Carolina ........... 425
Kansas ................. 194 South Dakota ............ 11
Kentucky ............... 421 Tennessee ............... 578
Louisiana ............... 461 Texas .................. 1,198
Maryland ............... 92 Utah .................. 8
Massachusetts ............ 10 Vermont ................ 20
Michigan ............... 330 Virginia ................ 307
Minnesota .............. 33 West Virginia ............ 179
Mississippi .............. 369 Wisconsin ............... 116
Most of our stores are located in leased premises. Individual store leases vary as to their terms,
rental provisions and expiration dates. Many stores are subject to build-to-suit arrangements with
landlords, which typically carry a primary lease term of up to 15 years with multiple renewal options.
We also have stores subject to shorter-term leases and many of these leases have renewal options. In
recent years, an increasing percentage of our new stores have been subject to build-to-suit
arrangements.
As of February 28, 2014, we operated twelve distribution centers, as described in the following
table:
Year Approximate Square Approximate Number
Location Opened Footage of Stores Served
Scottsville, KY ................. 1959 720,000 774
Ardmore, OK ................. 1994 1,310,000 1,380
South Boston, VA .............. 1997 1,250,000 926
Indianola, MS ................. 1998 820,000 803
Fulton, MO ................... 1999 1,150,000 1,256
Alachua, FL .................. 2000 980,000 947
Zanesville, OH ................ 2001 1,170,000 1,173
Jonesville, SC ................. 2005 1,120,000 1,107
Marion, IN ................... 2006 1,110,000 1,174
Bessemer, AL ................. 2012 940,000 1,025
Lebec, CA .................... 2012 600,000 253
Bethel, PA .................... 2014 1,000,000 397
20
10-K