Dollar General 2013 Annual Report Download - page 142
Download and view the complete annual report
Please find page 142 of the 2013 Dollar General annual report below. You can navigate through the pages in the report by either clicking on the pages listed below, or by using the keyword search tool below to find specific information within the annual report.-
 1
1 -
2
-
3
-
4
-
5
-
6
-
7
-
8
-
9
-
10
-
11
-
12
-
13
-
14
-
15
-
16
-
17
-
18
-
19
-
20
-
21
-
22
-
23
-
24
-
25
-
26
-
27
-
28
-
29
-
30
-
31
-
32
-
33
-
34
-
35
-
36
-
37
-
38
-
39
-
40
-
41
-
42
-
43
-
44
-
45
-
46
-
47
-
48
-
49
-
50
-
51
-
52
-
53
-
54
-
55
-
56
-
57
-
58
-
59
-
60
-
61
-
62
-
63
-
64
-
65
-
66
-
67
-
68
-
69
-
70
-
71
-
72
-
73
-
74
-
75
-
76
-
77
-
78
-
79
-
80
-
81
-
82
-
83
-
84
-
85
-
86
-
87
-
88
-
89
-
90
-
91
-
92
-
93
-
94
-
95
-
96
-
97
-
98
-
99
-
100
-
101
-
102
-
103
-
104
-
105
-
106
-
107
-
108
-
109
-
110
-
111
-
112
-
113
-
114
-
115
-
116
-
117
-
118
-
119
-
120
-
121
-
122
-
123
-
124
-
125
-
126
-
127
-
128
-
129
-
130
-
131
-
 132
132 -
 133
133 -
 134
134 -
 135
135 -
 136
136 -
 137
137 -
 138
138 -
 139
139 -
 140
140 -
 141
141 -
 142
142 -
 143
143 -
 144
144 -
 145
145 -
 146
146 -
 147
147 -
 148
148 -
 149
149 -
 150
150 -
 151
151 -
 152
152 -
153
-
154
-
155
-
156
-
157
-
158
-
159
-
160
-
161
-
162
-
163
-
164
-
165
-
166
-
167
-
168
-
169
-
170
-
171
-
172
-
173
-
174
-
175
-
176
-
177
-
178
-
179
-
180
-
181
-
182
 |
 |

DOLLAR GENERAL CORPORATION AND SUBSIDIARIES
NOTES TO CONSOLIDATED FINANCIAL STATEMENTS (Continued)
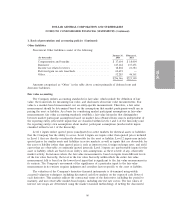
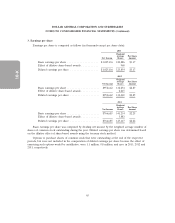
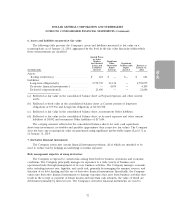
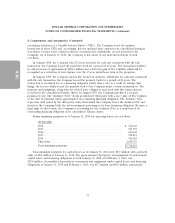
3. Earnings per share
Earnings per share is computed as follows (in thousands except per share data):
2013
Weighted
Average Per Share
Net Income Shares Amount
Basic earnings per share .................... $1,025,116 322,886 $3.17
Effect of dilutive share-based awards ........... 968
Diluted earnings per share .................. $1,025,116 323,854 $3.17
2012
Weighted
Average Per Share
Net Income Shares Amount
Basic earnings per share ..................... $952,662 332,254 $2.87
Effect of dilutive share-based awards ............ 2,215
Diluted earnings per share ................... $952,662 334,469 $2.85
2011
Weighted
Average Per Share
Net Income Shares Amount
Basic earnings per share ..................... $766,685 341,234 $2.25
Effect of dilutive share-based awards ............ 3,883
Diluted earnings per share ................... $766,685 345,117 $2.22
Basic earnings per share was computed by dividing net income by the weighted average number of
shares of common stock outstanding during the year. Diluted earnings per share was determined based
on the dilutive effect of share-based awards using the treasury stock method.
Options to purchase shares of common stock that were outstanding at the end of the respective
periods, but were not included in the computation of diluted earnings per share because the effect of
exercising such options would be antidilutive, were 1.1 million, 0.8 million, and zero in 2013, 2012 and
2011, respectively.
65
10-K