Dollar General 2013 Annual Report Download - page 134
Download and view the complete annual report
Please find page 134 of the 2013 Dollar General annual report below. You can navigate through the pages in the report by either clicking on the pages listed below, or by using the keyword search tool below to find specific information within the annual report.-
 1
1 -
2
-
3
-
4
-
5
-
6
-
7
-
8
-
9
-
10
-
11
-
12
-
13
-
14
-
15
-
16
-
17
-
18
-
19
-
20
-
21
-
22
-
23
-
24
-
25
-
26
-
27
-
28
-
29
-
30
-
31
-
32
-
33
-
34
-
35
-
36
-
37
-
38
-
39
-
40
-
41
-
42
-
43
-
44
-
45
-
46
-
47
-
48
-
49
-
50
-
51
-
52
-
53
-
54
-
55
-
56
-
57
-
58
-
59
-
60
-
61
-
62
-
63
-
64
-
65
-
66
-
67
-
68
-
69
-
70
-
71
-
72
-
73
-
74
-
75
-
76
-
77
-
78
-
79
-
80
-
81
-
82
-
83
-
84
-
85
-
86
-
87
-
88
-
89
-
90
-
91
-
92
-
93
-
94
-
95
-
96
-
97
-
98
-
99
-
100
-
101
-
102
-
103
-
104
-
105
-
106
-
107
-
108
-
109
-
110
-
111
-
112
-
113
-
114
-
115
-
116
-
117
-
118
-
119
-
120
-
121
-
122
-
123
-
 124
124 -
 125
125 -
 126
126 -
 127
127 -
 128
128 -
 129
129 -
 130
130 -
 131
131 -
 132
132 -
 133
133 -
 134
134 -
 135
135 -
 136
136 -
 137
137 -
 138
138 -
 139
139 -
 140
140 -
 141
141 -
 142
142 -
 143
143 -
 144
144 -
145
-
146
-
147
-
148
-
149
-
150
-
151
-
152
-
153
-
154
-
155
-
156
-
157
-
158
-
159
-
160
-
161
-
162
-
163
-
164
-
165
-
166
-
167
-
168
-
169
-
170
-
171
-
172
-
173
-
174
-
175
-
176
-
177
-
178
-
179
-
180
-
181
-
182
 |
 |

DOLLAR GENERAL CORPORATION AND SUBSIDIARIES
NOTES TO CONSOLIDATED FINANCIAL STATEMENTS (Continued)
1. Basis of presentation and accounting policies (Continued)
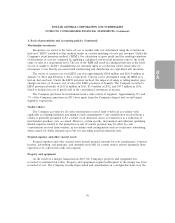
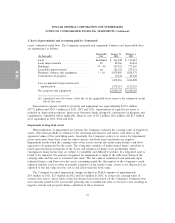
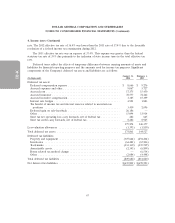
assets’ estimated useful lives. The Company’s property and equipment balances and depreciable lives
are summarized as follows:
Depreciable January 31, February 1,
(In thousands) Life 2014 2013
Land............................... Indefinite $ 163,448 $ 176,861
Land improvements .................... 20 48,566 80,834
Buildings ............................ 39 - 40 765,555 773,835
Leasehold improvements ................ (a) 326,122 279,351
Furniture, fixtures and equipment .......... 3 - 10 2,078,893 1,828,573
Construction in progress ................. 70,332 87,444
3,452,916 3,226,898
Less accumulated depreciation and
amortization ........................ 1,372,611 1,138,233
Net property and equipment .............. $2,080,305 $2,088,665
(a) amortized over the lesser of the life of the applicable lease term or the estimated useful
life of the asset
Depreciation expense related to property and equipment was approximately $315.3 million,
$277.2 million and $243.7 million for 2013, 2012 and 2011. Amortization of capital lease assets is
included in depreciation expense. Interest on borrowed funds during the construction of property and
equipment is capitalized where applicable. Interest costs of $1.2 million, $0.6 million and $1.5 million
were capitalized in 2013, 2012 and 2011.
Impairment of long-lived assets
When indicators of impairment are present, the Company evaluates the carrying value of long-lived
assets, other than goodwill, in relation to the operating performance and future cash flows or the
appraised values of the underlying assets. Generally, the Company’s policy is to review for impairment
stores open more than three years for which current cash flows from operations are negative.
Impairment results when the carrying value of the assets exceeds the undiscounted future cash flows
expected to be generated by the assets. The Company’s estimate of undiscounted future cash flows is
based upon historical operations of the stores and estimates of future store profitability which
encompasses many factors that are subject to variability and difficult to predict. If a long-lived asset is
found to be impaired, the amount recognized for impairment is equal to the difference between the
carrying value and the asset’s estimated fair value. The fair value is estimated based primarily upon
estimated future cash flows over the asset’s remaining useful life (discounted at the Company’s credit
adjusted risk-free rate) or other reasonable estimates of fair market value. Assets to be disposed of are
adjusted to the fair value less the cost to sell if less than the book value.
The Company recorded impairment charges included in SG&A expense of approximately
$0.5 million in 2013, $2.7 million in 2012 and $1.0 million in 2011, to reduce the carrying value of
certain of its stores’ assets. Such action was deemed necessary based on the Company’s evaluation that
such amounts would not be recoverable primarily due to insufficient sales or excessive costs resulting in
negative current and projected future cash flows at these locations.
57
10-K