Dollar General 2013 Annual Report Download - page 162
Download and view the complete annual report
Please find page 162 of the 2013 Dollar General annual report below. You can navigate through the pages in the report by either clicking on the pages listed below, or by using the keyword search tool below to find specific information within the annual report.-
 1
1 -
2
-
3
-
4
-
5
-
6
-
7
-
8
-
9
-
10
-
11
-
12
-
13
-
14
-
15
-
16
-
17
-
18
-
19
-
20
-
21
-
22
-
23
-
24
-
25
-
26
-
27
-
28
-
29
-
30
-
31
-
32
-
33
-
34
-
35
-
36
-
37
-
38
-
39
-
40
-
41
-
42
-
43
-
44
-
45
-
46
-
47
-
48
-
49
-
50
-
51
-
52
-
53
-
54
-
55
-
56
-
57
-
58
-
59
-
60
-
61
-
62
-
63
-
64
-
65
-
66
-
67
-
68
-
69
-
70
-
71
-
72
-
73
-
74
-
75
-
76
-
77
-
78
-
79
-
80
-
81
-
82
-
83
-
84
-
85
-
86
-
87
-
88
-
89
-
90
-
91
-
92
-
93
-
94
-
95
-
96
-
97
-
98
-
99
-
100
-
101
-
102
-
103
-
104
-
105
-
106
-
107
-
108
-
109
-
110
-
111
-
112
-
113
-
114
-
115
-
116
-
117
-
118
-
119
-
120
-
121
-
122
-
123
-
124
-
125
-
126
-
127
-
128
-
129
-
130
-
131
-
132
-
133
-
134
-
135
-
136
-
137
-
138
-
139
-
140
-
141
-
142
-
143
-
144
-
145
-
146
-
147
-
148
-
149
-
150
-
151
-
 152
152 -
 153
153 -
 154
154 -
 155
155 -
 156
156 -
 157
157 -
 158
158 -
 159
159 -
 160
160 -
 161
161 -
 162
162 -
 163
163 -
 164
164 -
 165
165 -
 166
166 -
 167
167 -
 168
168 -
 169
169 -
 170
170 -
 171
171 -
 172
172 -
173
-
174
-
175
-
176
-
177
-
178
-
179
-
180
-
181
-
182
 |
 |

DOLLAR GENERAL CORPORATION AND SUBSIDIARIES
NOTES TO CONSOLIDATED FINANCIAL STATEMENTS (Continued)
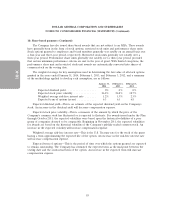
10. Share-based payments (Continued)
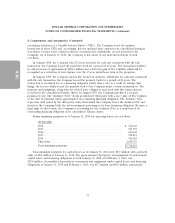
The weighted average grant date fair value of other options granted was $13.86, $13.54 and $13.14
during 2013, 2012 and 2011, respectively. The intrinsic value of other options exercised during 2013,
2012, and 2011 was $0.8 million, $0.3 million and $1.6 million, respectively.
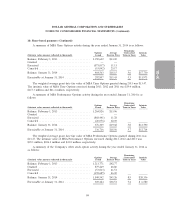
The number of performance share unit awards earned is based upon the Company’s annual
financial performance in the year of grant as specified in the award agreement. A summary of
performance share unit award activity during the year ended January 31, 2014 is as follows:
Units Intrinsic
(Intrinsic value amounts reflected in thousands) Issued Value
Balance, February 1, 2013 ............................. 162,688
Granted .......................................... 72,846
Converted to common stock ........................... (54,973)
Canceled ......................................... (21,142)
Balance, January 31, 2014 ............................. 159,419 $8,978
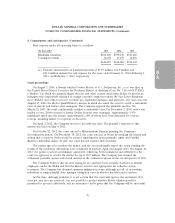
The weighted average grant date fair value of performance share units granted was $48.11 and
$45.25 during 2013 and 2012, respectively. No performance share units were granted during 2011.
A summary of restricted stock unit award activity during the year ended January 31, 2014 is as
follows:
Units Intrinsic
(Intrinsic value amounts reflected in thousands) Issued Value
Balance, February 1, 2013 ............................. 288,927
Granted .......................................... 509,440
Converted to common stock ........................... (98,063)
Canceled ......................................... (83,777)
Balance, January 31, 2014 ............................. 616,527 $34,723
The weighted average grant date fair value of restricted stock units granted was $48.20, $45.33 and
$33.16 during 2013, 2012 and 2011, respectively.
In March 2012, the Company issued a performance-based award of 326,037 shares of restricted
stock to its Chairman and Chief Executive Officer. This restricted stock award had a fair value on the
grant date of $45.25 per share and may vest in the future if certain specified earnings per share targets
for fiscal years 2014 and 2015 are achieved.
The Company currently believes that the performance targets related to the unvested MSA
Performance Options and restricted stock will be achieved. If such goals are not met, and no event
occurs which would result in the acceleration of vesting of these awards as specified in the underlying
agreements, future compensation cost relating to these unvested awards will not be recognized.
At January 31, 2014, the total unrecognized compensation cost related to nonvested stock-based
awards was $53.5 million with an expected weighted average expense recognition period of 1.5 years.
In October 2007, the Company’s Board of Directors adopted an Equity Appreciation Rights Plan,
which plan was later amended and restated (as amended and restated, the ‘‘Rights Plan’’). The Rights
85
10-K