Dollar General 2013 Annual Report Download - page 108
Download and view the complete annual report
Please find page 108 of the 2013 Dollar General annual report below. You can navigate through the pages in the report by either clicking on the pages listed below, or by using the keyword search tool below to find specific information within the annual report.-
 1
1 -
2
-
3
-
4
-
5
-
6
-
7
-
8
-
9
-
10
-
11
-
12
-
13
-
14
-
15
-
16
-
17
-
18
-
19
-
20
-
21
-
22
-
23
-
24
-
25
-
26
-
27
-
28
-
29
-
30
-
31
-
32
-
33
-
34
-
35
-
36
-
37
-
38
-
39
-
40
-
41
-
42
-
43
-
44
-
45
-
46
-
47
-
48
-
49
-
50
-
51
-
52
-
53
-
54
-
55
-
56
-
57
-
58
-
59
-
60
-
61
-
62
-
63
-
64
-
65
-
66
-
67
-
68
-
69
-
70
-
71
-
72
-
73
-
74
-
75
-
76
-
77
-
78
-
79
-
80
-
81
-
82
-
83
-
84
-
85
-
86
-
87
-
88
-
89
-
90
-
91
-
92
-
93
-
94
-
95
-
96
-
97
-
 98
98 -
 99
99 -
 100
100 -
 101
101 -
 102
102 -
 103
103 -
 104
104 -
 105
105 -
 106
106 -
 107
107 -
 108
108 -
 109
109 -
 110
110 -
 111
111 -
 112
112 -
 113
113 -
 114
114 -
 115
115 -
 116
116 -
 117
117 -
 118
118 -
119
-
120
-
121
-
122
-
123
-
124
-
125
-
126
-
127
-
128
-
129
-
130
-
131
-
132
-
133
-
134
-
135
-
136
-
137
-
138
-
139
-
140
-
141
-
142
-
143
-
144
-
145
-
146
-
147
-
148
-
149
-
150
-
151
-
152
-
153
-
154
-
155
-
156
-
157
-
158
-
159
-
160
-
161
-
162
-
163
-
164
-
165
-
166
-
167
-
168
-
169
-
170
-
171
-
172
-
173
-
174
-
175
-
176
-
177
-
178
-
179
-
180
-
181
-
182
 |
 |

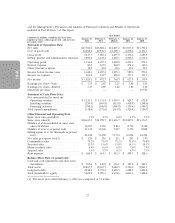
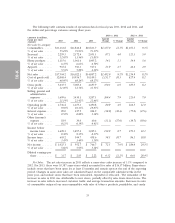
• Our gross profit rate declined by 69 basis points as sales of lower margin items increased at a
proportionally higher rate than sales of higher margin items. Specifically, we added tobacco
products and expanded our perishables offerings, both of which have lower gross profit rates. In
addition, our inventory shrinkage rate increased.
• The reduction in SG&A, as a percentage of sales, was due primarily to a significant decrease in
incentive compensation expense and efficiencies relating to store labor costs. For other factors,
see the detailed discussion that follows.
• Interest expense decreased by $38.9 million in 2013 to $89.0 million, reflecting lower average
borrowing rates which primarily resulted from the completion of our refinancing in the first
quarter of 2013. Total long-term obligations as of January 31, 2014 were $2.82 billion.
• We reported net income of $1.03 billion, or $3.17 per diluted share, for fiscal 2013, compared to
net income of $952.7 million, or $2.85 per diluted share, for fiscal 2012.
• We generated approximately $1.21 billion of cash flows from operating activities in 2013, an
increase of 7.2% compared to 2012. We primarily utilized our cash flows from operating
activities to invest in the growth of our business and repurchase our common stock.
• During 2013 we opened 650 new stores, remodeled or relocated 582 stores, and closed 24 stores.
Also in 2013, we repurchased approximately 11.0 million shares of our outstanding common stock
for $620.1 million, and we sold and leased back 233 of our stores, generating cash proceeds of
$281.6 million and resulting in a deferred gain of $67.2 million that will be recognized over a period of
15 years.
In 2014, we plan to continue to focus on our four key operating priorities. We expect our sales
growth in 2014 to again be driven by consumables as our customer continues to face both continuing
and new economic challenges. We plan to focus our efforts on effectively serving our core customers’
needs by providing them with the selections they want at the right price points in 2014.
We made progress in 2013 on implementing an improved supply chain solution to assist in
promotional and core inventory forecasting and ordering. We expect to make further progress in 2014,
and eventually all of our SKUs will be managed through this solution. The supply chain solution is
helping us improve our ordering processes in the stores and has contributed to our work simplification
efforts and improvements in maintaining efficient inventory levels. We believe we have additional
opportunities for work simplification and elimination in 2014.
We are pleased with the performance of our 2013 new stores, remodels and relocations, and in
2014 we plan to open 700 new stores and to continue our ongoing remodel and relocation efforts.
Finally, we plan to continue to repurchase shares of our common stock in 2014.
Key Financial Metrics. We have identified the following as our most critical financial metrics:
• Same-store sales growth;
• Sales per square foot;
• Gross profit, as a percentage of sales;
• Selling, general and administrative expenses, as a percentage of sales;
• Operating profit;
• Cash flow;
• Net income;
31
10-K