Dollar General 2013 Annual Report Download - page 49
Download and view the complete annual report
Please find page 49 of the 2013 Dollar General annual report below. You can navigate through the pages in the report by either clicking on the pages listed below, or by using the keyword search tool below to find specific information within the annual report.-
 1
1 -
2
-
3
-
4
-
5
-
6
-
7
-
8
-
9
-
10
-
11
-
12
-
13
-
14
-
15
-
16
-
17
-
18
-
19
-
20
-
21
-
22
-
23
-
24
-
25
-
26
-
27
-
28
-
29
-
30
-
31
-
32
-
33
-
34
-
35
-
36
-
37
-
38
-
 39
39 -
 40
40 -
 41
41 -
 42
42 -
 43
43 -
 44
44 -
 45
45 -
 46
46 -
 47
47 -
 48
48 -
 49
49 -
 50
50 -
 51
51 -
 52
52 -
 53
53 -
 54
54 -
 55
55 -
 56
56 -
 57
57 -
 58
58 -
 59
59 -
60
-
61
-
62
-
63
-
64
-
65
-
66
-
67
-
68
-
69
-
70
-
71
-
72
-
73
-
74
-
75
-
76
-
77
-
78
-
79
-
80
-
81
-
82
-
83
-
84
-
85
-
86
-
87
-
88
-
89
-
90
-
91
-
92
-
93
-
94
-
95
-
96
-
97
-
98
-
99
-
100
-
101
-
102
-
103
-
104
-
105
-
106
-
107
-
108
-
109
-
110
-
111
-
112
-
113
-
114
-
115
-
116
-
117
-
118
-
119
-
120
-
121
-
122
-
123
-
124
-
125
-
126
-
127
-
128
-
129
-
130
-
131
-
132
-
133
-
134
-
135
-
136
-
137
-
138
-
139
-
140
-
141
-
142
-
143
-
144
-
145
-
146
-
147
-
148
-
149
-
150
-
151
-
152
-
153
-
154
-
155
-
156
-
157
-
158
-
159
-
160
-
161
-
162
-
163
-
164
-
165
-
166
-
167
-
168
-
169
-
170
-
171
-
172
-
173
-
174
-
175
-
176
-
177
-
178
-
179
-
180
-
181
-
182
 |
 |

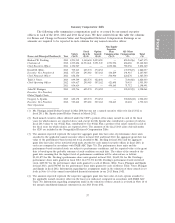
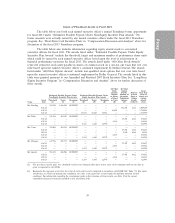
Summary Compensation Table
The following table summarizes compensation paid to or earned by our named executive
officers in each of the 2013, 2012 and 2011 fiscal years. We have omitted from this table the columns
for Bonus and Change in Pension Value and Nonqualified Deferred Compensation Earnings as no
amounts are required to be reported in such columns for any named executive officer.
Non-Equity
Incentive
Stock Option Plan All Other
Salary Awards Awards Compensation Compensation Total
Name and Principal Position(1) Year ($)(2) ($)(3) ($)(4) ($)(5) ($) ($)
Richard W. Dreiling, 2013 1,291,515 3,440,634 2,059,459 — 855,567(6) 7,647,175
Chairman & 2012 1,235,626 16,554,441 3,091,549 1,591,956 686,688 23,160,260
Chief Executive Officer 2011 1,196,947 — — 1,850,386 785,036 3,832,369
David M. Tehle, 2013 709,413 625,574 374,452 — 172,598(7) 1,882,037
Executive Vice President & 2012 677,136 295,483 507,162 436,209 191,915 2,107,905
Chief Financial Officer 2011 658,356 — — 506,906 220,278 1,385,540
Todd J. Vasos, 2013 699,549 625,574 422,846 — 72,464(8) 1,820,433
Chief Operating Officer 2012 654,617 295,483 507,162 421,698 76,435 1,955,395
2011 636,614 — — 490,165 71,712 1,198,491
John W. Flanigan, 2013 452,716 625,574 374,452 — 105,319(9) 1,558,061
Executive Vice President,
Global Supply Chain
Gregory A. Sparks, 2013 620,178 625,574 374,452 — 300,228(10) 1,920,432
Executive Vice President, 2012 523,618 295,483 507,162 338,643 65,404 1,730,310
Store Operations
(1) Mr. Flanigan joined Dollar General in May 2008 but was not a named executive officer for fiscal 2012 or
fiscal 2011. Mr. Sparks joined Dollar General in March 2012.
(2) Each named executive officer deferred under the CDP a portion of his salary earned in each of the fiscal
years for which salaries are reported above and, except for Mr. Sparks who contributed a portion of only his
fiscal 2013 salary to our 401(k) Plan, contributed to our 401(k) Plan a portion of his salary earned in each of
the fiscal years for which salaries are reported above. The amounts of the fiscal 2013 salary deferrals under
the CDP are included in the Nonqualified Deferred Compensation Table.
(3) The amounts reported represent the respective aggregate grant date fair value of performance share units
awarded to the applicable named executive officer in fiscal 2013 and fiscal 2012, the aggregate grant date fair
value of the performance-based restricted stock awarded to Mr. Dreiling in fiscal 2012 and the aggregate
grant date fair value of the restricted stock units awarded to each named executive officer in fiscal 2013, in
each case computed in accordance with FASB ASC Topic 718. The performance share units and the
performance-based restricted stock are subject to performance conditions, and the reported value at the grant
date is based upon the probable outcome of such conditions on such date. The values of the awards at the
grant date assuming that the highest level of performance conditions will be achieved are as follows:
$3,431,879 for Mr. Dreiling’s performance share units granted in fiscal 2013, $3,602,534 for Mr. Dreiling’s
performance share units granted in fiscal 2012, $14,753,174 for Mr. Dreiling’s performance-based restricted
stock, $623,987 for the performance share units granted to each of Messrs. Tehle, Vasos, Flanigan and Sparks
in fiscal 2013, and $590,965 for the performance share units granted to each of Messrs. Tehle, Vasos, Flanigan
and Sparks in fiscal 2012. Information regarding the assumptions made in the valuation of these awards is set
forth in Note 10 of the annual consolidated financial statements in our 2013 Form 10-K.
(4) The amounts reported represent the respective aggregate grant date fair value of stock options awarded to
the applicable named executive officer in the fiscal year indicated, computed in accordance with FASB ASC
Topic 718. Information regarding assumptions made in the valuation of these awards is set forth in Note 10 of
the annual consolidated financial statements in our 2013 Form 10-K.
37
Proxy