Dollar General 2013 Annual Report Download - page 165
Download and view the complete annual report
Please find page 165 of the 2013 Dollar General annual report below. You can navigate through the pages in the report by either clicking on the pages listed below, or by using the keyword search tool below to find specific information within the annual report.-
 1
1 -
2
-
3
-
4
-
5
-
6
-
7
-
8
-
9
-
10
-
11
-
12
-
13
-
14
-
15
-
16
-
17
-
18
-
19
-
20
-
21
-
22
-
23
-
24
-
25
-
26
-
27
-
28
-
29
-
30
-
31
-
32
-
33
-
34
-
35
-
36
-
37
-
38
-
39
-
40
-
41
-
42
-
43
-
44
-
45
-
46
-
47
-
48
-
49
-
50
-
51
-
52
-
53
-
54
-
55
-
56
-
57
-
58
-
59
-
60
-
61
-
62
-
63
-
64
-
65
-
66
-
67
-
68
-
69
-
70
-
71
-
72
-
73
-
74
-
75
-
76
-
77
-
78
-
79
-
80
-
81
-
82
-
83
-
84
-
85
-
86
-
87
-
88
-
89
-
90
-
91
-
92
-
93
-
94
-
95
-
96
-
97
-
98
-
99
-
100
-
101
-
102
-
103
-
104
-
105
-
106
-
107
-
108
-
109
-
110
-
111
-
112
-
113
-
114
-
115
-
116
-
117
-
118
-
119
-
120
-
121
-
122
-
123
-
124
-
125
-
126
-
127
-
128
-
129
-
130
-
131
-
132
-
133
-
134
-
135
-
136
-
137
-
138
-
139
-
140
-
141
-
142
-
143
-
144
-
145
-
146
-
147
-
148
-
149
-
150
-
151
-
152
-
153
-
154
-
 155
155 -
 156
156 -
 157
157 -
 158
158 -
 159
159 -
 160
160 -
 161
161 -
 162
162 -
 163
163 -
 164
164 -
 165
165 -
 166
166 -
 167
167 -
 168
168 -
 169
169 -
 170
170 -
 171
171 -
 172
172 -
 173
173 -
 174
174 -
 175
175 -
176
-
177
-
178
-
179
-
180
-
181
-
182
 |
 |

DOLLAR GENERAL CORPORATION AND SUBSIDIARIES
NOTES TO CONSOLIDATED FINANCIAL STATEMENTS (Continued)
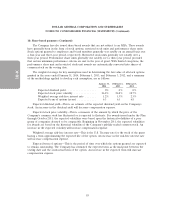
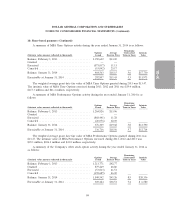
14. Quarterly financial data (unaudited)
The following is selected unaudited quarterly financial data for the fiscal years ended January 31,
2014 and February 1, 2013. Each quarterly period listed below was a 13-week accounting period. The
sum of the four quarters for any given year may not equal annual totals due to rounding.
First Second Third Fourth
(In thousands) Quarter Quarter Quarter Quarter
2013:
Net sales ............................... $4,233,733 $4,394,651 $4,381,838 $4,493,945
Gross profit ............................. 1,295,148 1,377,290 1,328,493 1,434,811
Operating profit .......................... 395,000 412,822 390,241 538,122
Net income ............................. 220,083 245,475 237,385 322,173
Basic earnings per share .................... 0.67 0.76 0.74 1.01
Diluted earnings per share .................. 0.67 0.75 0.74 1.01
First Second Third Fourth
(In thousands) Quarter Quarter Quarter Quarter
2012:
Net sales ............................... $3,901,205 $3,948,655 $3,964,647 $4,207,621
Gross profit ............................. 1,228,256 1,263,223 1,226,123 1,367,799
Operating profit .......................... 384,324 387,214 361,389 522,349
Net income ............................. 213,415 214,140 207,685 317,422
Basic earnings per share .................... 0.64 0.64 0.62 0.97
Diluted earnings per share .................. 0.63 0.64 0.62 0.97
As discussed in Note 5, in the first quarter of 2013, the Company terminated its senior secured
credit facilities, resulting in a pretax loss of $18.9 million ($11.5 million net of tax, or $0.04 per diluted
share) which was recognized as Other (income) expense.
As discussed in Note 8, in the second quarter of 2013, the Company recorded expenses associated
with an agreement to settle a legal matter, resulting in a pretax loss of $8.5 million ($5.2 million net of
tax, or $0.02 per diluted share) which was recognized as Selling, general and administrative expense.
As discussed in Note 5, in the second quarter of 2012, the Company redeemed its outstanding
senior subordinated notes due 2017, resulting in a pretax loss of $29.0 million ($17.7 million net of tax,
or $0.05 per diluted share) which was recognized as Other (income) expense.
88
10-K