Dollar General 2013 Annual Report Download - page 151
Download and view the complete annual report
Please find page 151 of the 2013 Dollar General annual report below. You can navigate through the pages in the report by either clicking on the pages listed below, or by using the keyword search tool below to find specific information within the annual report.-
 1
1 -
2
-
3
-
4
-
5
-
6
-
7
-
8
-
9
-
10
-
11
-
12
-
13
-
14
-
15
-
16
-
17
-
18
-
19
-
20
-
21
-
22
-
23
-
24
-
25
-
26
-
27
-
28
-
29
-
30
-
31
-
32
-
33
-
34
-
35
-
36
-
37
-
38
-
39
-
40
-
41
-
42
-
43
-
44
-
45
-
46
-
47
-
48
-
49
-
50
-
51
-
52
-
53
-
54
-
55
-
56
-
57
-
58
-
59
-
60
-
61
-
62
-
63
-
64
-
65
-
66
-
67
-
68
-
69
-
70
-
71
-
72
-
73
-
74
-
75
-
76
-
77
-
78
-
79
-
80
-
81
-
82
-
83
-
84
-
85
-
86
-
87
-
88
-
89
-
90
-
91
-
92
-
93
-
94
-
95
-
96
-
97
-
98
-
99
-
100
-
101
-
102
-
103
-
104
-
105
-
106
-
107
-
108
-
109
-
110
-
111
-
112
-
113
-
114
-
115
-
116
-
117
-
118
-
119
-
120
-
121
-
122
-
123
-
124
-
125
-
126
-
127
-
128
-
129
-
130
-
131
-
132
-
133
-
134
-
135
-
136
-
137
-
138
-
139
-
140
-
 141
141 -
 142
142 -
 143
143 -
 144
144 -
 145
145 -
 146
146 -
 147
147 -
 148
148 -
 149
149 -
 150
150 -
 151
151 -
 152
152 -
 153
153 -
 154
154 -
 155
155 -
 156
156 -
 157
157 -
 158
158 -
 159
159 -
 160
160 -
 161
161 -
162
-
163
-
164
-
165
-
166
-
167
-
168
-
169
-
170
-
171
-
172
-
173
-
174
-
175
-
176
-
177
-
178
-
179
-
180
-
181
-
182
 |
 |

DOLLAR GENERAL CORPORATION AND SUBSIDIARIES
NOTES TO CONSOLIDATED FINANCIAL STATEMENTS (Continued)
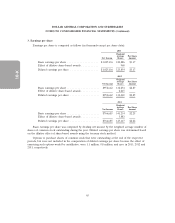
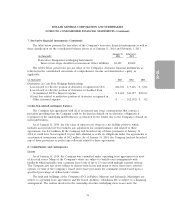
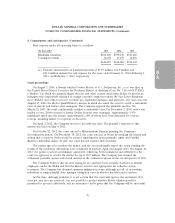
7. Derivative financial instruments (Continued)
The table below presents the fair value of the Company’s derivative financial instruments as well as
their classification on the consolidated balance sheets as of January 31, 2014 and February 1, 2013:
January 31, February 1,
(in thousands) 2014 2013
Derivatives Designated as Hedging Instruments
Interest rate swaps classified as noncurrent Other liabilities $4,109 $4,822
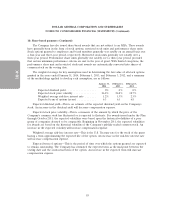
The tables below present the pre-tax effect of the Company’s derivative financial instruments as
reflected in the consolidated statements of comprehensive income and shareholders’ equity, as
applicable:
(in thousands) 2013 2012 2011
Derivatives in Cash Flow Hedging Relationships
Loss related to effective portion of derivative recognized in OCI ..... $16,036 $ 9,626 $ 3,836
Loss related to effective portion of derivative reclassified from
Accumulated OCI to Interest expense ....................... $ 4,604 $13,327 $28,633
(Gain) loss related to ineffective portion of derivative recognized in
Other (income) expense ................................. $ — $(2,392) $ 312
Credit-risk-related contingent features
The Company has agreements with all of its interest rate swap counterparties that contain a
provision providing that the Company could be declared in default on its derivative obligations if
repayment of the underlying indebtedness is accelerated by the lender due to the Company’s default on
such indebtedness.
As of January 31, 2014, the fair value of interest rate swaps in a net liability position, which
includes accrued interest but excludes any adjustment for nonperformance risk related to these
agreements, was $4.2 million. If the Company had breached any of these provisions at January 31,
2014, it could have been required to post full collateral or settle its obligations under the agreements at
an estimated termination value of $4.2 million. As of January 31, 2014, the Company had not breached
any of these provisions or posted any collateral related to these agreements.
8. Commitments and contingencies
Leases
As of January 31, 2014, the Company was committed under operating lease agreements for most
of its retail stores. Many of the Company’s stores are subject to build-to-suit arrangements with
landlords which typically carry a primary lease term of up to 15 years with multiple renewal options.
The Company also has stores subject to shorter-term leases and many of these leases have renewal
options. Certain of the Company’s leased stores have provisions for contingent rentals based upon a
specified percentage of defined sales volume.
The land and buildings of the Company’s DCs in Fulton, Missouri and Indianola, Mississippi are
subject to operating lease agreements and the leased Ardmore, Oklahoma DC is subject to a financing
arrangement. The entities involved in the ownership structure underlying these leases meet the
74
10-K