Dollar General 2013 Annual Report Download - page 39
Download and view the complete annual report
Please find page 39 of the 2013 Dollar General annual report below. You can navigate through the pages in the report by either clicking on the pages listed below, or by using the keyword search tool below to find specific information within the annual report.-
 1
1 -
2
-
3
-
4
-
5
-
6
-
7
-
8
-
9
-
10
-
11
-
12
-
13
-
14
-
15
-
16
-
17
-
18
-
19
-
20
-
21
-
22
-
23
-
24
-
25
-
26
-
27
-
28
-
 29
29 -
 30
30 -
 31
31 -
 32
32 -
 33
33 -
 34
34 -
 35
35 -
 36
36 -
 37
37 -
 38
38 -
 39
39 -
 40
40 -
 41
41 -
 42
42 -
 43
43 -
 44
44 -
 45
45 -
 46
46 -
 47
47 -
 48
48 -
 49
49 -
50
-
51
-
52
-
53
-
54
-
55
-
56
-
57
-
58
-
59
-
60
-
61
-
62
-
63
-
64
-
65
-
66
-
67
-
68
-
69
-
70
-
71
-
72
-
73
-
74
-
75
-
76
-
77
-
78
-
79
-
80
-
81
-
82
-
83
-
84
-
85
-
86
-
87
-
88
-
89
-
90
-
91
-
92
-
93
-
94
-
95
-
96
-
97
-
98
-
99
-
100
-
101
-
102
-
103
-
104
-
105
-
106
-
107
-
108
-
109
-
110
-
111
-
112
-
113
-
114
-
115
-
116
-
117
-
118
-
119
-
120
-
121
-
122
-
123
-
124
-
125
-
126
-
127
-
128
-
129
-
130
-
131
-
132
-
133
-
134
-
135
-
136
-
137
-
138
-
139
-
140
-
141
-
142
-
143
-
144
-
145
-
146
-
147
-
148
-
149
-
150
-
151
-
152
-
153
-
154
-
155
-
156
-
157
-
158
-
159
-
160
-
161
-
162
-
163
-
164
-
165
-
166
-
167
-
168
-
169
-
170
-
171
-
172
-
173
-
174
-
175
-
176
-
177
-
178
-
179
-
180
-
181
-
182
 |
 |

Use of Market Benchmarking Data. We pay compensation that is competitive with the external
market for executive talent to attract and retain named executive officers who we believe will help
improve our business. We believe that this primary talent market consists of retail companies with
revenues both larger and smaller than ours and with business models similar to ours. Those companies
are likely to have executive positions comparable in breadth, complexity and scope of responsibility to
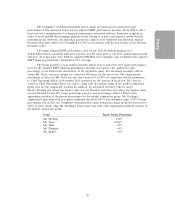
ours. Our market comparator group for 2013 compensation decisions consisted of AutoZone, Big Lots,
Family Dollar, McDonald’s, OfficeMax, PetSmart, Staples, J.C. Penney, The Gap, Macy’s, Ross Stores,
TJX Companies, Kohls, Starbucks, Limited Brands, Dollar Tree, Foot Locker, Safeway and Yum!
Brands.
For decisions related to 2013 executive compensation, the Committee reviewed survey data
provided by Meridian from the market comparator group and referenced compensation data provided
by management from the previous three years of the proxy statements of the market comparator group
for those companies where comparable positions could be identified. In determining the compensation
changes related to Mr. Vasos’ promotion to Chief Operating Officer in November 2013, the Committee
reviewed median data from the most recent proxy statements of the nine companies (Big Lots, Dollar
Tree, Family Dollar, Foot Locker, J.C. Penney, McDonald’s, PetSmart, Ross Stores and Safeway) in our
market comparator group that reported data for a comparable position.
For 2014 executive compensation decisions other than Mr. Dreiling, the Committee reviewed
2013 market comparator group data that was increased by 3%, as recommended by Meridian to
maintain alignment with the general market. In the case of Mr. Dreiling’s 2014 compensation, to
ensure that the Committee was aware of any significant movement in CEO compensation levels within
the market comparator group, Meridian provided current survey data from the 2013 market comparator
group.
Elements of Named Executive Officer Compensation
We provide compensation in the form of base salary, short-term cash incentives, long-term
equity incentives, benefits and limited perquisites. We believe each of these elements is a necessary
component of the total compensation package and is consistent with compensation programs at
companies with whom we compete both for business and talent.
Base Salary. Base salary promotes the recruiting and retention functions of our compensation
program by reflecting the salaries for comparable positions in the competitive marketplace, rewarding
strong performance, and providing a stable and predictable income source for our executives. Because
we likely would be unable to attract or retain quality named executive officers in the absence of
competitive base salary levels, this component constitutes a significant portion of the total
compensation package. Our employment agreements with the named executive officers set forth
minimum base salary levels, but the Compensation Committee retains sole discretion to increase these
levels from time to time.
(a) Named Executive Officers Other than Mr. Dreiling. In each of 2013 and 2014, the
Compensation Committee determined, with Messrs. Dreiling (regarding performance assessments) and
Ravener’s (regarding salary percentage increases) recommendation, that the named executive officers’
performance assessments relative to other executives supported a percentage increase equal to that
which was budgeted for our entire U.S.-based employee population (see ‘‘Use of Performance
Evaluations’’) as such increases, along with the other compensation components, would maintain total
2013 compensation within the median range of the market comparator group. Accordingly, each of the
named executive officers received the budgeted 2.75% annual base salary increase in 2013 and 2.45%
in 2014. All such increases were effective as of April 1 of the applicable year. Additionally, upon his
promotion to Chief Operating Officer in November 2013, the Committee determined that Mr. Vasos
should receive a salary increase of 9.15%, as this increase targeted the median range of the market
comparator group data for the companies that reported data for a comparable position.
27
Proxy