Dollar General 2013 Annual Report Download - page 45
Download and view the complete annual report
Please find page 45 of the 2013 Dollar General annual report below. You can navigate through the pages in the report by either clicking on the pages listed below, or by using the keyword search tool below to find specific information within the annual report.-
 1
1 -
2
-
3
-
4
-
5
-
6
-
7
-
8
-
9
-
10
-
11
-
12
-
13
-
14
-
15
-
16
-
17
-
18
-
19
-
20
-
21
-
22
-
23
-
24
-
25
-
26
-
27
-
28
-
29
-
30
-
31
-
32
-
33
-
34
-
 35
35 -
 36
36 -
 37
37 -
 38
38 -
 39
39 -
 40
40 -
 41
41 -
 42
42 -
 43
43 -
 44
44 -
 45
45 -
 46
46 -
 47
47 -
 48
48 -
 49
49 -
 50
50 -
 51
51 -
 52
52 -
 53
53 -
 54
54 -
 55
55 -
56
-
57
-
58
-
59
-
60
-
61
-
62
-
63
-
64
-
65
-
66
-
67
-
68
-
69
-
70
-
71
-
72
-
73
-
74
-
75
-
76
-
77
-
78
-
79
-
80
-
81
-
82
-
83
-
84
-
85
-
86
-
87
-
88
-
89
-
90
-
91
-
92
-
93
-
94
-
95
-
96
-
97
-
98
-
99
-
100
-
101
-
102
-
103
-
104
-
105
-
106
-
107
-
108
-
109
-
110
-
111
-
112
-
113
-
114
-
115
-
116
-
117
-
118
-
119
-
120
-
121
-
122
-
123
-
124
-
125
-
126
-
127
-
128
-
129
-
130
-
131
-
132
-
133
-
134
-
135
-
136
-
137
-
138
-
139
-
140
-
141
-
142
-
143
-
144
-
145
-
146
-
147
-
148
-
149
-
150
-
151
-
152
-
153
-
154
-
155
-
156
-
157
-
158
-
159
-
160
-
161
-
162
-
163
-
164
-
165
-
166
-
167
-
168
-
169
-
170
-
171
-
172
-
173
-
174
-
175
-
176
-
177
-
178
-
179
-
180
-
181
-
182
 |
 |

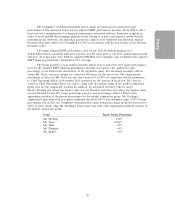
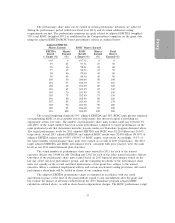
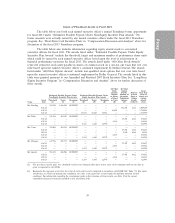
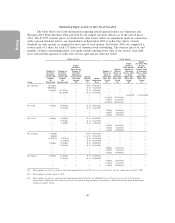
The performance share units can be earned if certain performance measures are achieved
during the performance period (which was fiscal year 2013) and if certain additional vesting
requirements are met. The performance measures are goals related to adjusted EBITDA (weighted
50%) and ROIC (weighted 50%) as established by the Compensation Committee on the grant date,
using the adjusted EBITDA/ROIC-based performance criteria as outlined below:
Adjusted EBITDA
Shares Earned ROIC Shares Earned
EBITDA Shares ROIC Shares Total
Result Earned Result Earned Shares
v. Target (%) (%) v. Target (%) (%) Earned (%)
<95 0 <97.51 0 0
95 25 97.51 25 50
96 30 98.01 30 60
97 35 98.51 35 70
98 40 99.00 40 80
99 45 99.50 45 90
100 50 100.00 50 100
101 55 100.50 55 110
102 60 101.00 60 120
103 65 101.49 65 130
104 70 101.99 70 140
105 75 102.49 75 150
106 80 102.99 80 160
107 85 103.48 85 170
108 90 103.98 90 180
109 95 104.48 95 190
110 100 104.98 100 200
The revised weighting (formerly 90% adjusted EBITDA and 10% ROIC) puts greater emphasis
on maintaining ROIC at an acceptable level to help ensure that invested capital is providing an
appropriate return over time. The number of performance share units earned could vary between 0%
and 200% of the target number based on actual performance compared to target performance on the
same graduated scale that determines incentive payouts under our Teamshare program discussed above.
The target performance levels for 2013 adjusted EBITDA and ROIC were $2.210 billion and 20.10%,
respectively. Actual 2013 adjusted EBITDA and adjusted ROIC results were $2.090 billion (94.58% of
adjusted EBITDA target) and 19.89% (98.96% of ROIC target), respectively. Accordingly, 39.5% of
the target number of performance share units were earned as a result of 2013 performance. The 2013
target adjusted EBITDA and ROIC performance levels, consistent with prior practice, were the same
levels as our 2013 annual financial plan objectives.
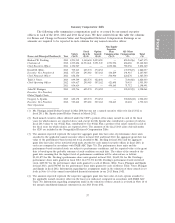
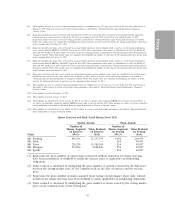
The actual number of performance share units earned for 2013 for each of the named
executive officers was 14,088 for Mr. Dreiling and 2,562 for each of the other named executive officers.
One-third of the performance share units earned based on 2013 financial performance vested on the
last day of the one-year performance period, and the remaining two-thirds of the performance share
units vest equally on the second and third anniversaries of the grant date, subject to the named
executive officer’s continued employment with us and certain accelerated vesting provisions. All vested
performance share units will be settled in shares of our common stock.
The adjusted EBITDA performance target is computed in accordance with our credit
agreements in place at the time of the grant without regard to any amendments after the grant date
but exclude the impact of all items excluded from the 2013 Teamshare program adjusted EBIT
calculation outlined above, as well as share-based compensation charges. The ROIC performance target
33
Proxy