Dollar General 2013 Annual Report Download - page 164
Download and view the complete annual report
Please find page 164 of the 2013 Dollar General annual report below. You can navigate through the pages in the report by either clicking on the pages listed below, or by using the keyword search tool below to find specific information within the annual report.-
 1
1 -
2
-
3
-
4
-
5
-
6
-
7
-
8
-
9
-
10
-
11
-
12
-
13
-
14
-
15
-
16
-
17
-
18
-
19
-
20
-
21
-
22
-
23
-
24
-
25
-
26
-
27
-
28
-
29
-
30
-
31
-
32
-
33
-
34
-
35
-
36
-
37
-
38
-
39
-
40
-
41
-
42
-
43
-
44
-
45
-
46
-
47
-
48
-
49
-
50
-
51
-
52
-
53
-
54
-
55
-
56
-
57
-
58
-
59
-
60
-
61
-
62
-
63
-
64
-
65
-
66
-
67
-
68
-
69
-
70
-
71
-
72
-
73
-
74
-
75
-
76
-
77
-
78
-
79
-
80
-
81
-
82
-
83
-
84
-
85
-
86
-
87
-
88
-
89
-
90
-
91
-
92
-
93
-
94
-
95
-
96
-
97
-
98
-
99
-
100
-
101
-
102
-
103
-
104
-
105
-
106
-
107
-
108
-
109
-
110
-
111
-
112
-
113
-
114
-
115
-
116
-
117
-
118
-
119
-
120
-
121
-
122
-
123
-
124
-
125
-
126
-
127
-
128
-
129
-
130
-
131
-
132
-
133
-
134
-
135
-
136
-
137
-
138
-
139
-
140
-
141
-
142
-
143
-
144
-
145
-
146
-
147
-
148
-
149
-
150
-
151
-
152
-
153
-
 154
154 -
 155
155 -
 156
156 -
 157
157 -
 158
158 -
 159
159 -
 160
160 -
 161
161 -
 162
162 -
 163
163 -
 164
164 -
 165
165 -
 166
166 -
 167
167 -
 168
168 -
 169
169 -
 170
170 -
 171
171 -
 172
172 -
 173
173 -
 174
174 -
175
-
176
-
177
-
178
-
179
-
180
-
181
-
182
 |
 |

DOLLAR GENERAL CORPORATION AND SUBSIDIARIES
NOTES TO CONSOLIDATED FINANCIAL STATEMENTS (Continued)
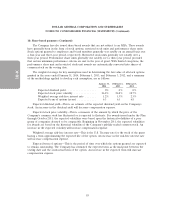
12. Segment reporting
The Company manages its business on the basis of one reportable segment. See Note 1 for a brief
description of the Company’s business. As of January 31, 2014, all of the Company’s operations were
located within the United States with the exception of a Hong Kong subsidiary, and a liaison office in
India, the collective assets and revenues of which are not material. The following net sales data is
presented in accordance with accounting standards related to disclosures about segments of an
enterprise.
(In thousands) 2013 2012 2011
Classes of similar products:
Consumables .................... $13,161,825 $11,844,846 $10,833,735
Seasonal ........................ 2,259,516 2,172,399 2,051,098
Home products ................... 1,115,648 1,061,573 1,005,219
Apparel ........................ 967,178 943,310 917,136
Net sales ...................... $17,504,167 $16,022,128 $14,807,188
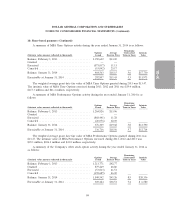
13. Common stock transactions
On August 29, 2012, the Company’s Board of Directors authorized a common stock repurchase
program, which was increased on March 19, 2013 and again on December 4, 2013. As of January 31,
2014, a total of $2.0 billion had been authorized under the program and $1.02 billion remained
available for repurchase. The repurchase authorization has no expiration date and allows repurchases
from time to time in the open market or in privately negotiated transactions. The timing and number
of shares purchased depends on a variety of factors, such as price, market conditions, compliance with
the covenants and restrictions under our debt agreements and other factors. Repurchases under the
program may be funded from available cash or borrowings under the Company’s credit facilities
discussed in further detail in Note 5.
During the years ended January 31, 2014, February 1, 2013, and February 3, 2012, the Company
repurchased approximately 11.0 million shares of its common stock at a total cost of $620.1 million,
approximately 14.4 million shares at a total cost of $671.4 million, and approximately 4.9 million shares
of its common stock at a total cost of $185.0 million, respectively, pursuant to its common stock
repurchase programs.
87
10-K