Dollar General 2013 Annual Report Download - page 161
Download and view the complete annual report
Please find page 161 of the 2013 Dollar General annual report below. You can navigate through the pages in the report by either clicking on the pages listed below, or by using the keyword search tool below to find specific information within the annual report.-
 1
1 -
2
-
3
-
4
-
5
-
6
-
7
-
8
-
9
-
10
-
11
-
12
-
13
-
14
-
15
-
16
-
17
-
18
-
19
-
20
-
21
-
22
-
23
-
24
-
25
-
26
-
27
-
28
-
29
-
30
-
31
-
32
-
33
-
34
-
35
-
36
-
37
-
38
-
39
-
40
-
41
-
42
-
43
-
44
-
45
-
46
-
47
-
48
-
49
-
50
-
51
-
52
-
53
-
54
-
55
-
56
-
57
-
58
-
59
-
60
-
61
-
62
-
63
-
64
-
65
-
66
-
67
-
68
-
69
-
70
-
71
-
72
-
73
-
74
-
75
-
76
-
77
-
78
-
79
-
80
-
81
-
82
-
83
-
84
-
85
-
86
-
87
-
88
-
89
-
90
-
91
-
92
-
93
-
94
-
95
-
96
-
97
-
98
-
99
-
100
-
101
-
102
-
103
-
104
-
105
-
106
-
107
-
108
-
109
-
110
-
111
-
112
-
113
-
114
-
115
-
116
-
117
-
118
-
119
-
120
-
121
-
122
-
123
-
124
-
125
-
126
-
127
-
128
-
129
-
130
-
131
-
132
-
133
-
134
-
135
-
136
-
137
-
138
-
139
-
140
-
141
-
142
-
143
-
144
-
145
-
146
-
147
-
148
-
149
-
150
-
 151
151 -
 152
152 -
 153
153 -
 154
154 -
 155
155 -
 156
156 -
 157
157 -
 158
158 -
 159
159 -
 160
160 -
 161
161 -
 162
162 -
 163
163 -
 164
164 -
 165
165 -
 166
166 -
 167
167 -
 168
168 -
 169
169 -
 170
170 -
 171
171 -
172
-
173
-
174
-
175
-
176
-
177
-
178
-
179
-
180
-
181
-
182
 |
 |

DOLLAR GENERAL CORPORATION AND SUBSIDIARIES
NOTES TO CONSOLIDATED FINANCIAL STATEMENTS (Continued)
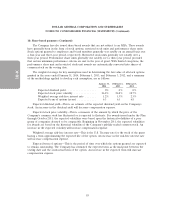
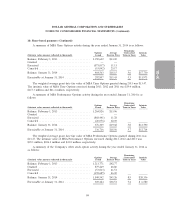
10. Share-based payments (Continued)
A summary of MSA Time Options activity during the year ended January 31, 2014 is as follows:
Remaining
Options Average Contractual Intrinsic
(Intrinsic value amounts reflected in thousands) Issued Exercise Price Term in Years Value
Balance, February 1, 2013 .................... 1,350,642 $13.69
Granted ................................. — —
Exercised ................................ (871,037) 11.11
Canceled ................................. (15,042) 25.17
Balance, January 31, 2014 .................... 464,563 $18.15 5.6 $17,730
Exercisable at January 31, 2014 ................ 292,807 $15.43 5.3 $11,973
The weighted average grant date fair value of MSA Time Options granted during 2011 was $13.47.
The intrinsic value of MSA Time Options exercised during 2013, 2012 and 2011 was $39.4 million,
$117.3 million and $41.4 million, respectively.
A summary of MSA Performance Options activity during the year ended January 31, 2014 is as
follows:
Remaining
Options Average Contractual Intrinsic
(Intrinsic value amounts reflected in thousands) Issued Exercise Price Term in Years Value
Balance, February 1, 2013 .................... 1,264,826 $13.96
Granted ................................. — —
Exercised ................................ (868,441) 11.28
Canceled ................................. (20,076) 22.69
Balance, January 31, 2014 .................... 376,309 $19.68 5.8 $13,790
Exercisable at January 31, 2014 ................ 336,716 $18.56 5.7 $12,714
The weighted average grant date fair value of MSA Performance Options granted during 2011 was
$13.47. The intrinsic value of MSA Performance Options exercised during 2013, 2012 and 2011 was
$39.1 million, $106.4 million and $41.8 million, respectively.
A summary of the Company’s other stock option activity during the year ended January 31, 2014 is
as follows:
Remaining
Options Average Contractual Intrinsic
(Intrinsic value amounts reflected in thousands) Issued Exercise Price Term in Years Value
Balance, February 1, 2013 .................... 1,211,771 $42.77
Granted ................................. 875,269 48.80
Exercised ................................ (53,813) 41.51
Canceled ................................. (192,685) 46.69
Balance, January 31, 2014 .................... 1,840,542 $45.26 8.5 $20,356
Exercisable at January 31, 2014 ................ 369,424 $38.51 7.4 $ 6,580
84
10-K