Dollar General 2013 Annual Report Download - page 144
Download and view the complete annual report
Please find page 144 of the 2013 Dollar General annual report below. You can navigate through the pages in the report by either clicking on the pages listed below, or by using the keyword search tool below to find specific information within the annual report.-
 1
1 -
2
-
3
-
4
-
5
-
6
-
7
-
8
-
9
-
10
-
11
-
12
-
13
-
14
-
15
-
16
-
17
-
18
-
19
-
20
-
21
-
22
-
23
-
24
-
25
-
26
-
27
-
28
-
29
-
30
-
31
-
32
-
33
-
34
-
35
-
36
-
37
-
38
-
39
-
40
-
41
-
42
-
43
-
44
-
45
-
46
-
47
-
48
-
49
-
50
-
51
-
52
-
53
-
54
-
55
-
56
-
57
-
58
-
59
-
60
-
61
-
62
-
63
-
64
-
65
-
66
-
67
-
68
-
69
-
70
-
71
-
72
-
73
-
74
-
75
-
76
-
77
-
78
-
79
-
80
-
81
-
82
-
83
-
84
-
85
-
86
-
87
-
88
-
89
-
90
-
91
-
92
-
93
-
94
-
95
-
96
-
97
-
98
-
99
-
100
-
101
-
102
-
103
-
104
-
105
-
106
-
107
-
108
-
109
-
110
-
111
-
112
-
113
-
114
-
115
-
116
-
117
-
118
-
119
-
120
-
121
-
122
-
123
-
124
-
125
-
126
-
127
-
128
-
129
-
130
-
131
-
132
-
133
-
 134
134 -
 135
135 -
 136
136 -
 137
137 -
 138
138 -
 139
139 -
 140
140 -
 141
141 -
 142
142 -
 143
143 -
 144
144 -
 145
145 -
 146
146 -
 147
147 -
 148
148 -
 149
149 -
 150
150 -
 151
151 -
 152
152 -
 153
153 -
 154
154 -
155
-
156
-
157
-
158
-
159
-
160
-
161
-
162
-
163
-
164
-
165
-
166
-
167
-
168
-
169
-
170
-
171
-
172
-
173
-
174
-
175
-
176
-
177
-
178
-
179
-
180
-
181
-
182
 |
 |

DOLLAR GENERAL CORPORATION AND SUBSIDIARIES
NOTES TO CONSOLIDATED FINANCIAL STATEMENTS (Continued)
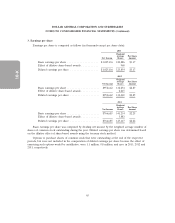
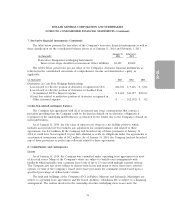
4. Income taxes (Continued)
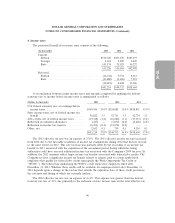
rate. The 2012 effective tax rate of 36.4% was lower than the 2011 rate of 37.4% due to the favorable
resolution of a federal income tax examination during 2012.
The 2011 effective tax rate was an expense of 37.4%. This expense was greater than the federal
statutory tax rate of 35% due primarily to the inclusion of state income taxes in the total effective tax
rate.
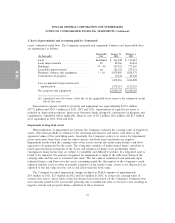
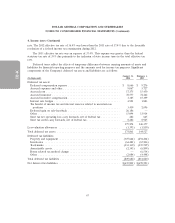
Deferred taxes reflect the effects of temporary differences between carrying amounts of assets and
liabilities for financial reporting purposes and the amounts used for income tax purposes. Significant
components of the Company’s deferred tax assets and liabilities are as follows:
January 31, February 1,
(In thousands) 2014 2013
Deferred tax assets:
Deferred compensation expense ................................. $ 8,666 $ 9,276
Accrued expenses and other .................................... 9,067 5,727
Accrued rent ............................................... 17,375 15,450
Accrued insurance ........................................... 78,557 72,442
Accrued incentive compensation ................................. 3,385 15,399
Interest rate hedges .......................................... 4,921 1,883
Tax benefit of income tax and interest reserves related to uncertain tax
positions ................................................ 3,439 2,696
Deferred gain on sale-leaseback ................................. 26,186 —
Other .................................................... 15,094 13,914
State tax net operating loss carry forwards, net of federal tax ............ 282 645
State tax credit carry forwards, net of federal tax ..................... 8,282 8,925
175,254 146,357
Less valuation allowances ....................................... (1,393) (1,830)
Total deferred tax assets ........................................ 173,861 144,527
Deferred tax liabilities:
Property and equipment ....................................... (307,644) (294,204)
Inventories ................................................ (64,481) (67,246)
Trademarks ................................................ (433,130) (435,529)
Amortizable assets ........................................... (2,343) (6,809)
Bonus related tax method change ................................ — (6,534)
Other .................................................... (2,084) (4,498)
Total deferred tax liabilities ...................................... (809,682) (814,820)
Net deferred tax liabilities ....................................... $(635,821) $(670,293)
67
10-K