Dollar General 2013 Annual Report Download - page 116
Download and view the complete annual report
Please find page 116 of the 2013 Dollar General annual report below. You can navigate through the pages in the report by either clicking on the pages listed below, or by using the keyword search tool below to find specific information within the annual report.-
 1
1 -
2
-
3
-
4
-
5
-
6
-
7
-
8
-
9
-
10
-
11
-
12
-
13
-
14
-
15
-
16
-
17
-
18
-
19
-
20
-
21
-
22
-
23
-
24
-
25
-
26
-
27
-
28
-
29
-
30
-
31
-
32
-
33
-
34
-
35
-
36
-
37
-
38
-
39
-
40
-
41
-
42
-
43
-
44
-
45
-
46
-
47
-
48
-
49
-
50
-
51
-
52
-
53
-
54
-
55
-
56
-
57
-
58
-
59
-
60
-
61
-
62
-
63
-
64
-
65
-
66
-
67
-
68
-
69
-
70
-
71
-
72
-
73
-
74
-
75
-
76
-
77
-
78
-
79
-
80
-
81
-
82
-
83
-
84
-
85
-
86
-
87
-
88
-
89
-
90
-
91
-
92
-
93
-
94
-
95
-
96
-
97
-
98
-
99
-
100
-
101
-
102
-
103
-
104
-
105
-
 106
106 -
 107
107 -
 108
108 -
 109
109 -
 110
110 -
 111
111 -
 112
112 -
 113
113 -
 114
114 -
 115
115 -
 116
116 -
 117
117 -
 118
118 -
 119
119 -
 120
120 -
 121
121 -
 122
122 -
 123
123 -
 124
124 -
 125
125 -
 126
126 -
127
-
128
-
129
-
130
-
131
-
132
-
133
-
134
-
135
-
136
-
137
-
138
-
139
-
140
-
141
-
142
-
143
-
144
-
145
-
146
-
147
-
148
-
149
-
150
-
151
-
152
-
153
-
154
-
155
-
156
-
157
-
158
-
159
-
160
-
161
-
162
-
163
-
164
-
165
-
166
-
167
-
168
-
169
-
170
-
171
-
172
-
173
-
174
-
175
-
176
-
177
-
178
-
179
-
180
-
181
-
182
 |
 |

credit valuation adjustment is reflected in our derivative valuations. The total expected exposure of a
derivative is derived using market-observable inputs, such as yield curves and volatilities. The inputs
utilized for our own credit spread are based on implied spreads from our publicly-traded debt. For
counterparties with publicly available credit information, the credit spreads over LIBOR used in the
calculations represent implied credit default swap spreads obtained from a third party credit data
provider. In adjusting the fair value of our derivative contracts for the effect of nonperformance risk,
we have considered the impact of netting and any applicable credit enhancements, such as collateral
postings, thresholds, mutual puts, and guarantees. Additionally, we actively monitor counterparty credit
ratings for any significant changes.
As of January 31, 2014, the net credit valuation adjustments had an insignificant impact on the
settlement values of our derivative liabilities. Various factors impact changes in the credit valuation
adjustments over time, including changes in the credit spreads of the parties to the contracts, as well as
changes in market rates and volatilities, which affect the total expected exposure of the derivative
instruments. When appropriate, valuations are also adjusted for various factors such as liquidity and
bid/offer spreads, which factors we deemed to be immaterial as of January 31, 2014.
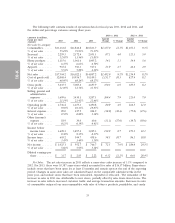
Contractual Obligations
The following table summarizes our significant contractual obligations and commercial
commitments as of January 31, 2014 (in thousands):
Payments Due by Period
Contractual obligations Total 1 year 1 - 3 years 3 - 5 years 5+ years
Long-term debt obligations .......... $2,814,495 $ 75,000 $ 200,305 $1,625,770 $ 913,420
Capital lease obligations ............ 6,841 966 2,232 1,412 2,231
Interest(a) ...................... 437,655 75,536 146,249 92,050 123,820
Self-insurance liabilities(b) .......... 232,483 86,056 90,688 32,614 23,125
Operating leases(c) ............... 5,738,832 712,563 1,275,836 1,050,678 2,699,755
Subtotal ...................... $9,230,306 $950,121 $1,715,310 $2,802,524 $3,762,351
Commitments Expiring by Period
Commercial commitments(d) Total 1 year 1 - 3 years 3 - 5 years 5+ years
Letters of credit ................ $ 22,671 $ 22,671 $ — $ — $ —
Purchase obligations(e) .......... 783,407 725,984 40,749 16,674 —
Subtotal .................... $ 806,078 $ 748,655 $ 40,749 $ 16,674 $ —
Total contractual obligations and
commercial commitments(f) ..... $10,036,384 $1,698,776 $1,756,059 $2,819,198 $3,762,351
(a) Represents obligations for interest payments on long-term debt and capital lease obligations, and
includes projected interest on variable rate long-term debt, using 2013 year end rates. Variable rate
long-term debt includes the balance of the senior revolving credit facility (which had a balance of
zero as of January 31, 2014), the balance of our tax increment financing of $14.5 million, and the
unhedged portion of the senior term loan facility of $125 million.
(b) We retain a significant portion of the risk for our workers’ compensation, employee health
insurance, general liability, property loss and automobile insurance. As these obligations do not
have scheduled maturities, these amounts represent undiscounted estimates based upon actuarial
assumptions. Reserves for workers’ compensation and general liability which existed as of the date
39
10-K