Dollar General 2013 Annual Report Download - page 118
Download and view the complete annual report
Please find page 118 of the 2013 Dollar General annual report below. You can navigate through the pages in the report by either clicking on the pages listed below, or by using the keyword search tool below to find specific information within the annual report.
Cash flows
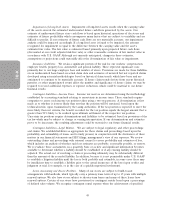
Cash flows from operating activities. Significant components of the increase in cash flows from
operating activities in 2013 compared to 2012 include increased net income due primarily to increased
sales and lower SG&A expenses, as a percentage of sales, in 2013 as described in more detail above
under ‘‘Results of Operations.’’ Significant components of the increase in cash flows from operating
activities were related to changes in working capital, including Merchandise inventories, Accounts
payable and Accrued expenses and other. The impact of the changes in inventory balances, which
increased in both years but by a lesser amount in 2013 compared to 2012, is explained in more detail
below. Items positively affecting Accrued expenses and other include the timing of accruals and
payments for legal settlements and non-income taxes (primarily sales taxes), and the adjustment of
accruals during 2012 resulting from the favorable resolution of income tax examinations which did not
recur in 2013. Partially offsetting the positive impact of the items discussed above were reduced
incentive compensation accruals, increased cash payments for income taxes, and changes in Accounts
payable, which are affected by the timing and mix of merchandise purchases, the most significant
category of which were domestic purchases.
On an ongoing basis, we closely monitor and manage our inventory balances, and they may
fluctuate from period to period based on new store openings, the timing of purchases, and other
factors. Merchandise inventories increased by 7% during 2013, compared to a 19% increase in 2012.
The percentage increase in inventories in 2013 was less than the prior year due to our emphasis on
more effective inventory management and our related efforts to control shrink. Inventory levels in the
consumables category increased by $168.0 million, or 12%, in 2013 compared to an increase of
$245.7 million, or 22%, in 2012. The seasonal category decreased by $4.7 million, or 1%, in 2013
compared to an increase of $70.2 million, or 18%, in 2012. The home products category increased
$22.0 million, or 9%, in 2013 compared to an increase of $56.2 million, or 29%, in 2012. The apparel
category decreased by $29.5 million, or 9%, in 2013 compared to an increase of $16.0 million, or 5%,
in 2012.
Significant components of the increase in cash flows from operating activities in 2012 compared to
2011 include increased net income due primarily to increased sales and lower SG&A expenses, as a
percentage of sales, in 2012 as described in more detail above under ‘‘Results of Operations.’’ A
portion of the changes in Prepaid and other current assets as well as Accrued expenses and other
reflect the activity associated with a legal settlement accrued in 2011 for which payments were made in
2012. Changes in Accrued expenses and other were also affected by higher sales tax accruals at the end
of 2011 and the adjustment of accruals during 2012 due to the favorable resolution of income tax
examinations. The reclassification of the tax benefit of stock options to cash flows from financing
activities was higher in 2012 due to an increase in stock options exercised. Changes in Accounts payable
were due to increased merchandise purchases as discussed in more detail below, the most significant
category of which were domestic purchases.
In addition, our inventories increased by 19% during 2012, compared to a 14% increase in 2011.
The increase in inventories in 2012 was due to several factors including new items introduced in 2012,
the receipt during 2012 of certain items related to our 2013 merchandising initiatives, and the emphasis
on improved presentation levels of select merchandise categories. Inventory levels in the consumables
category increased by $245.7 million, or 22%, in 2012 compared to an increase of $132.3 million, or
13%, in 2011. The seasonal category increased by $70.2 million, or 18%, in 2012 compared to an
increase of $27.5 million, or 7%, in 2011. The home products category increased $56.2 million, or 29%,
in 2012 compared to an increase of $24.6 million, or 14%, in 2011. The apparel category increased by
$16.0 million, or 5%, in 2012 compared to an increase of $59.4 million, or 24%, in 2011.
Cash flows from investing activities. Cash expenditures for purchases of property and equipment
decreased by 5.8% from 2012 to 2013. Significant components of property and equipment purchases in
41
10-K


