Comcast 2009 Annual Report Download - page 78
Download and view the complete annual report
Please find page 78 of the 2009 Comcast annual report below. You can navigate through the pages in the report by either clicking on the pages listed below, or by using the keyword search tool below to find specific information within the annual report.-
 1
1 -
2
-
3
-
4
-
5
-
6
-
7
-
8
-
9
-
10
-
11
-
12
-
13
-
14
-
15
-
16
-
17
-
18
-
19
-
20
-
21
-
22
-
23
-
24
-
25
-
26
-
27
-
28
-
29
-
30
-
31
-
32
-
33
-
34
-
35
-
36
-
37
-
38
-
39
-
40
-
41
-
42
-
43
-
44
-
45
-
46
-
47
-
48
-
49
-
50
-
51
-
52
-
53
-
54
-
55
-
56
-
57
-
58
-
59
-
60
-
61
-
62
-
63
-
64
-
65
-
66
-
67
-
 68
68 -
 69
69 -
 70
70 -
 71
71 -
 72
72 -
 73
73 -
 74
74 -
 75
75 -
 76
76 -
 77
77 -
 78
78 -
 79
79 -
 80
80 -
 81
81 -
 82
82 -
 83
83 -
 84
84 -
 85
85 -
 86
86 -
 87
87 -
 88
88 -
89
-
90
-
91
-
92
-
93
-
94
-
95
-
96
-
97
-
98
-
99
-
100
-
101
-
102
-
103
-
104
-
105
-
106
-
107
-
108
-
109
-
110
-
111
-
112
-
113
-
114
-
115
-
116
-
117
-
118
-
119
-
120
-
121
-
122
-
123
-
124
-
125
-
126
-
127
-
128
-
129
-
130
-
131
-
132
-
133
-
134
-
135
-
136
-
137
-
138
-
139
-
140
-
141
-
142
-
143
-
144
-
145
-
146
-
147
-
148
-
149
-
150
-
151
-
152
-
153
-
154
-
155
-
156
-
157
-
158
-
159
-
160
-
161
-
162
-
163
-
164
-
165
-
166
-
167
-
168
-
169
-
170
-
171
-
172
-
173
-
174
-
175
-
176
-
177
-
178
-
179
-
180
-
181
-
182
-
183
-
184
-
185
-
186
-
187
-
188
-
189
-
190
-
191
-
192
-
193
-
194
-
195
-
196
-
197
-
198
-
199
-
200
-
201
-
202
-
203
-
204
-
205
-
206
-
207
-
208
-
209
-
210
-
211
-
212
-
213
-
214
-
215
-
216
-
217
-
218
-
219
-
220
-
221
-
222
-
223
-
224
-
225
-
226
-
227
-
228
-
229
-
230
-
231
 |
 |

Table of Contents
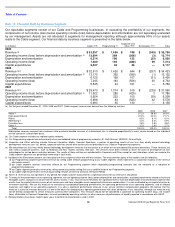
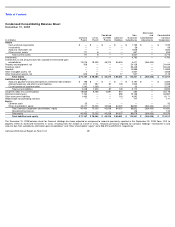
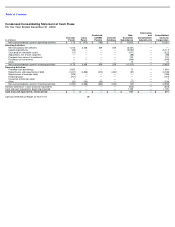
Note 18: Financial Data by Business Segment
Our reportable segments consist of our Cable and Programming businesses. In evaluating the profitability of our segments, the
components of net income (loss) below operating income (loss) before depreciation and amortization are not separately evaluated
by our management. Assets are not allocated to segments for management reporting although approximately 95% of our assets
relate to the Cable segment. Our financial data by business segment is presented in the table below.
(in millions)
Cable
Programming
Corporate and
Other
Eliminations
Total
2009
Revenue
$
33,857
$
1,496
$
748
$
(345
)
$
35,756
Operating income (loss) before depreciation and amortization
13,694
389
(366
)
(3
)
13,714
Depreciation and amortization
6,214
196
122
(32
)
6,500
Operating income (loss)
7,480
193
(488
)
29
7,214
Capital expenditures
5,037
34
46
—
5,117
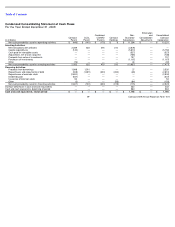
2008
Revenue
$
32,610
$
1,426
$
644
$
(257
)
$
34,423
Operating income (loss) before depreciation and amortization
13,170
362
(399
)
(1
)
13,132
Depreciation and amortization
6,125
199
107
(31
)
6,400
Operating income (loss)
7,045
163
(506
)
30
6,732
Capital expenditures
5,545
44
161
—
5,750
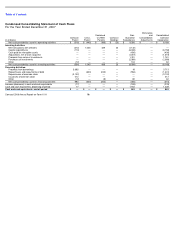
2007
Revenue
$
29,470
$
1,314
$
515
$
(239
)
$
31,060
Operating income (loss) before depreciation and amortization
11,922
286
(425
)
3
11,786
Depreciation and amortization
5,924
223
100
(39
)
6,208
Operating income (loss)
5,998
63
(525
)
42
5,578
Capital expenditures
5,993
35
130
—
6,158
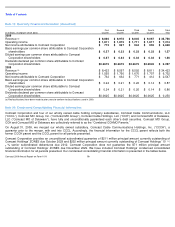
(a)
For the years ended December 31, 2009, 2008 and 2007, Cable segment revenue was derived from the following services:
2009
2008
2007
Video
57.2
%
58.8
%
60.9
%
High-speed Internet
22.9
%
22.2
%
21.7
%
Phone
9.6
%
8.1
%
6.0
%
Advertising
4.3
%
5.2
%
5.9
%
Franchise fees
2.8
%
2.8
%
2.8
%
Other
3.2
%
2.9
%
2.7
%
Total
100.0
%
100.0
%
100.0
%
Subscription revenue received from customers who purchase bundled services at a discounted rate is allocated proportionally to each service based on the individual
service’s price on a stand-alone basis.
(b)
Our Cable segment includes our regional sports networks.
(c)
Our Programming segment consists primarily of our consolidated national programming networks, E!, Golf Channel, VERSUS, G4 and Style.
(d)
Corporate and Other activities include Comcast Interactive Media, Comcast Spectacor, a portion of operating results of our less than wholly owned technology
development ventures (see “(e)” below), corporate activities and all other businesses not presented in our Cable or Programming segments.
(e)
We consolidate our less than wholly owned technology development ventures that we control or of which we are considered the primary beneficiary. These ventures are
with various corporate partners, such as Motorola and Rovi Guides (formerly Gemstar). The ventures have been created to share the costs of development of new
technologies for set-
top boxes and other devices. The results of these entities are included within Corporate and Other except for cost allocations, which are made to the
Cable segment based on our percentage ownership in each entity.
(f)
Included in the Eliminations column are transactions that our segments enter into with one another. The most common types of transactions are the following:
4
our Programming segment generates revenue by selling cable network programming to our Cable segment, which represents a substantial majority of the revenue
elimination amount
4
our Cable segment receives incentives offered by our Programming segment when negotiating programming contracts that are recorded as a reduction of
programming expenses
4
our Cable segment generates revenue by selling advertising and by selling the use of satellite feeds to our Programming segment
4
our Cable segment generates revenue by providing network services to Comcast Interactive Media
(g)
Non-U.S. revenue was not significant in any period. No single customer accounted for a significant amount of our revenue in any period.
(h)
To measure the performance of our operating segments, we use operating income (loss) before depreciation and amortization, excluding impairments related to fixed and
intangible assets, and gains or losses from the sale of assets, if any. This measure eliminates the significant level of noncash depreciation and amortization expense that
results from the capital-
intensive nature of our businesses and from intangible assets recognized in business combinations. It is also unaffected by our capital structure or
investment activities. We use this measure to evaluate our consolidated operating performance, the operating performance of our operating segments, and to allocate
resources and capital to our operating segments. It is also a significant performance measure in our annual incentive compensation programs. We believe that this
measure is useful to investors because it is one of the bases for comparing our operating performance with other companies in our industries, although our measure may
not be directly comparable to similar measures used by other companies. This measure should not be considered a substitute for operating income (loss), net income
(loss) attributable to Comcast Corporation, net cash provided by operating activities or other measures of performance or liquidity reported in accordance with GAAP.
(i)
Reclassifications have been made to prior years to conform to classifications used in 2009.
69
Comcast 2009 Annual Report on Form 10-
K
(a)(b) (c) (d)(e) (e)(f)
(g)
(h)
(g)(i)
(h)
(g)(i)
(h)
(i)
(i)
(i)