Comcast 2009 Annual Report Download - page 67
Download and view the complete annual report
Please find page 67 of the 2009 Comcast annual report below. You can navigate through the pages in the report by either clicking on the pages listed below, or by using the keyword search tool below to find specific information within the annual report.-
 1
1 -
2
-
3
-
4
-
5
-
6
-
7
-
8
-
9
-
10
-
11
-
12
-
13
-
14
-
15
-
16
-
17
-
18
-
19
-
20
-
21
-
22
-
23
-
24
-
25
-
26
-
27
-
28
-
29
-
30
-
31
-
32
-
33
-
34
-
35
-
36
-
37
-
38
-
39
-
40
-
41
-
42
-
43
-
44
-
45
-
46
-
47
-
48
-
49
-
50
-
51
-
52
-
53
-
54
-
55
-
56
-
 57
57 -
 58
58 -
 59
59 -
 60
60 -
 61
61 -
 62
62 -
 63
63 -
 64
64 -
 65
65 -
 66
66 -
 67
67 -
 68
68 -
 69
69 -
 70
70 -
 71
71 -
 72
72 -
 73
73 -
 74
74 -
 75
75 -
 76
76 -
 77
77 -
78
-
79
-
80
-
81
-
82
-
83
-
84
-
85
-
86
-
87
-
88
-
89
-
90
-
91
-
92
-
93
-
94
-
95
-
96
-
97
-
98
-
99
-
100
-
101
-
102
-
103
-
104
-
105
-
106
-
107
-
108
-
109
-
110
-
111
-
112
-
113
-
114
-
115
-
116
-
117
-
118
-
119
-
120
-
121
-
122
-
123
-
124
-
125
-
126
-
127
-
128
-
129
-
130
-
131
-
132
-
133
-
134
-
135
-
136
-
137
-
138
-
139
-
140
-
141
-
142
-
143
-
144
-
145
-
146
-
147
-
148
-
149
-
150
-
151
-
152
-
153
-
154
-
155
-
156
-
157
-
158
-
159
-
160
-
161
-
162
-
163
-
164
-
165
-
166
-
167
-
168
-
169
-
170
-
171
-
172
-
173
-
174
-
175
-
176
-
177
-
178
-
179
-
180
-
181
-
182
-
183
-
184
-
185
-
186
-
187
-
188
-
189
-
190
-
191
-
192
-
193
-
194
-
195
-
196
-
197
-
198
-
199
-
200
-
201
-
202
-
203
-
204
-
205
-
206
-
207
-
208
-
209
-
210
-
211
-
212
-
213
-
214
-
215
-
216
-
217
-
218
-
219
-
220
-
221
-
222
-
223
-
224
-
225
-
226
-
227
-
228
-
229
-
230
-
231
 |
 |

Table of Contents
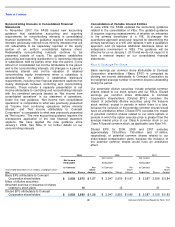
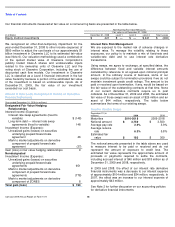
Our financial instruments measured at fair value on a nonrecurring basis are presented in the table below.
Nonrecurring Fair Value Measures
Fair value as of December 31, 2008
(in millions)
December 31, 2008
Level 1
Level 2
Level 3
Total Losses
Equity method investments
$
421
$
—
$
—
$
421
$
(600
)
Comcast 2009 Annual Report on Form 10-K
58
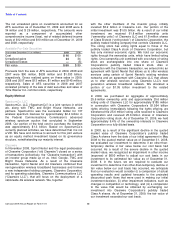
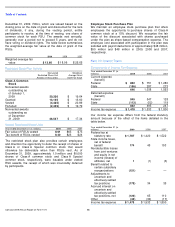
We recognized an other-than-temporary impairment for the
year ended December 31, 2008 to other income (expense) of
$600 million to adjust the cost basis of our approximately $1
billion investment in Clearwire LLC to its estimated fair value
(see Note 6). Our valuation methodology used a combination
of the quoted market value of Clearwire Corporation’s
publicly traded Class A shares and unobservable inputs
related to the ownership units of Clearwire LLC and the
voting stock of Clearwire Corporation, including the use of
discounted cash flow models. Our investment in Clearwire
LLC is classified as a Level 3 financial instrument in the fair
value hierarchy because a portion of the estimated fair value
of the investment is based on unobservable inputs. As of
December 31, 2009, the fair value of our investment
exceeded our cost basis.
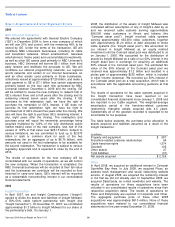
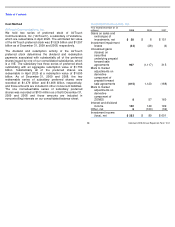
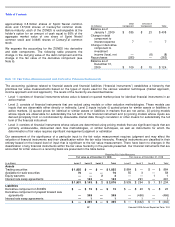
Amount of Gain (Loss) Recognized in Income on Derivative
Financial Instruments
Year ended December 31, 2009 (in millions)
Designated Fair Value Hedging
Relationships
Interest Income (Expense):
Interest rate swap agreements (fixed to
variable)
$
(148
)
Long-term debt — interest rate swap
agreements (fixed to variable)
148
Investment Income (Expense):
Unrealized gains (losses) on securities
underlying prepaid forward sale
agreement
46
Mark to market adjustments on derivative
component of prepaid forward sale
agreement
(37
)
Gain (loss) on fair value hedging relationships
9
Nondesignated
Investment Income (Expense):
Unrealized gains (losses) on securities
underlying prepaid forward sale
agreements
951
Mark to market adjustments on derivative
component of prepaid forward sale
agreements
(778
)
Mark to market adjustments on derivative
component of ZONES
8
Total gain (loss)
$
190
Interest Rate Risk Management
We are exposed to the market risk of adverse changes in
interest rates. To manage the volatility relating to these
exposures, our policy is to maintain a mix of fixed-rate and
variable-rate debt and to use interest rate derivative
transactions.
Using swaps, we agree to exchange, at specified dates, the
difference between fixed and variable interest amounts
calculated by reference to an agreed-upon notional principal
amount. In the ordinary course of business, some of our
swaps could be subject to termination provisions if we do not
maintain investment grade credit ratings. The amount to be
paid or received upon termination, if any, would be based on
the fair value of the outstanding contracts at that time. None
of our current derivative contracts require us to post
collateral. As of December 31, 2009 and 2008, the estimated
fair value of those swaps was an asset of $26 million and an
asset of $44 million, respectively. The table below
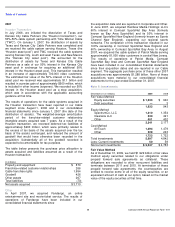
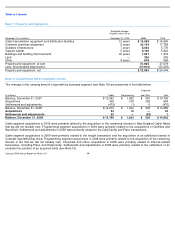
summarizes the terms of our existing swaps.
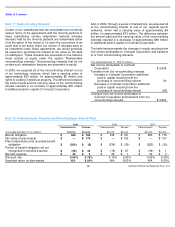
Fixed to Variable Swaps
The notional amounts presented in the table above are used
to measure interest to be paid or received and do not
represent the amount of exposure to credit loss. The
estimated fair value represents the approximate amount of
proceeds or payments required to settle the contracts,
including accrued interest of $40 million and $18 million as of
December 31, 2009 and 2008, respectively.
In 2009 and 2008, the effect of our interest rate derivative
financial instruments was a decrease to our interest expense
of approximately $104 million and $34 million, respectively. In
2007, the effect was an increase to our interest expense of
approximately $43 million.
See Note 2 for further discussion on our accounting policies
for derivative financial instruments.
December 31 (in
millions)
2009
2008
Maturities
2010
-
2018
2009
-
2018
Notional amount
$
3,750
$
3,500
Average pay rate
2.9
%
3.9
%
Average receive
rate
6.3
%
5.8
%
Estimated fair
value
$
183
$
309