Comcast 2009 Annual Report Download - page 33
Download and view the complete annual report
Please find page 33 of the 2009 Comcast annual report below. You can navigate through the pages in the report by either clicking on the pages listed below, or by using the keyword search tool below to find specific information within the annual report.-
 1
1 -
2
-
3
-
4
-
5
-
6
-
7
-
8
-
9
-
10
-
11
-
12
-
13
-
14
-
15
-
16
-
17
-
18
-
19
-
20
-
21
-
22
-
 23
23 -
 24
24 -
 25
25 -
 26
26 -
 27
27 -
 28
28 -
 29
29 -
 30
30 -
 31
31 -
 32
32 -
 33
33 -
 34
34 -
 35
35 -
 36
36 -
 37
37 -
 38
38 -
 39
39 -
 40
40 -
 41
41 -
 42
42 -
 43
43 -
44
-
45
-
46
-
47
-
48
-
49
-
50
-
51
-
52
-
53
-
54
-
55
-
56
-
57
-
58
-
59
-
60
-
61
-
62
-
63
-
64
-
65
-
66
-
67
-
68
-
69
-
70
-
71
-
72
-
73
-
74
-
75
-
76
-
77
-
78
-
79
-
80
-
81
-
82
-
83
-
84
-
85
-
86
-
87
-
88
-
89
-
90
-
91
-
92
-
93
-
94
-
95
-
96
-
97
-
98
-
99
-
100
-
101
-
102
-
103
-
104
-
105
-
106
-
107
-
108
-
109
-
110
-
111
-
112
-
113
-
114
-
115
-
116
-
117
-
118
-
119
-
120
-
121
-
122
-
123
-
124
-
125
-
126
-
127
-
128
-
129
-
130
-
131
-
132
-
133
-
134
-
135
-
136
-
137
-
138
-
139
-
140
-
141
-
142
-
143
-
144
-
145
-
146
-
147
-
148
-
149
-
150
-
151
-
152
-
153
-
154
-
155
-
156
-
157
-
158
-
159
-
160
-
161
-
162
-
163
-
164
-
165
-
166
-
167
-
168
-
169
-
170
-
171
-
172
-
173
-
174
-
175
-
176
-
177
-
178
-
179
-
180
-
181
-
182
-
183
-
184
-
185
-
186
-
187
-
188
-
189
-
190
-
191
-
192
-
193
-
194
-
195
-
196
-
197
-
198
-
199
-
200
-
201
-
202
-
203
-
204
-
205
-
206
-
207
-
208
-
209
-
210
-
211
-
212
-
213
-
214
-
215
-
216
-
217
-
218
-
219
-
220
-
221
-
222
-
223
-
224
-
225
-
226
-
227
-
228
-
229
-
230
-
231
 |
 |

Table of Contents
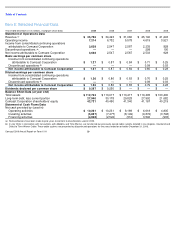
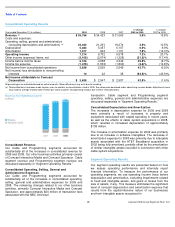
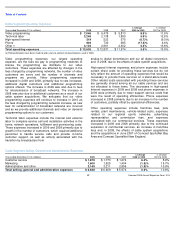
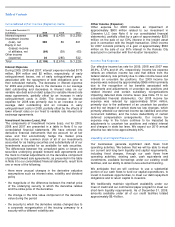
Cable Segment Operating Expenses
(a) Reclassifications have been made to prior years to conform to classifications used in 2009.
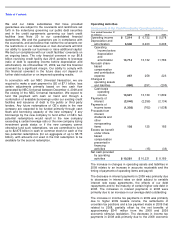
Cable Segment Selling, General and Administrative Expenses
Year ended December 31 (in millions)
2009
2008
2007
% Change
2008 to 2009
% Change
2007 to 2008
Video programming
$
7,046
$
6,479
$
5,813
8.8
%
11.5
%
Technical labor
2,245
2,138
1,899
5.0
%
12.6
%
High-speed Internet
519
523
575
(0.7
)%
(9.0
)%
Phone
602
730
685
(17.5
)%
6.6
%
Other
3,123
2,961
2,602
5.4
%
13.8
%
Total operating expenses
$
13,535
$
12,831
$
11,574
5.5
%
10.9
%
Year ended December 31 (in millions)
2009
2008
2007
% Change
2008 to 2009
% Change
2007 to 2008
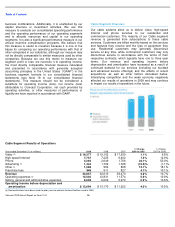
Customer service
$
1,879
$
1,773
$
1,674
6.0
%
5.9
%
Marketing
1,600
1,625
1,404
(1.5
)%
15.7
%
Administrative and other
3,149
3,211
2,896
(1.9
)%
10.9
%
Total selling, general and administrative expenses
$
6,628
$
6,609
$
5,974
0.3
%
10.6
%
27
Comcast 2009 Annual Report on Form 10-
K
(a)
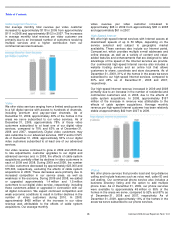
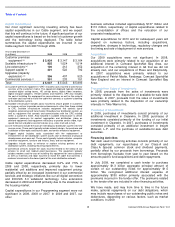
Video programming expenses, our largest operating
expense, are the fees we pay to programming networks to
license the programming we distribute to our video
customers. These expenses are affected by changes in the
fees charged by programming networks, the number of video
customers we serve and the number of channels and
programs we provide. Video programming expenses
increased in 2009 and 2008, primarily due to rate increases,
additional digital customers and additional programming
options offered. The increase in 2009 was also due to fees
for retransmission of broadcast networks. The increase in
2008 was also due to additional customers as a result of our
cable system acquisitions. We anticipate that our video
programming expenses will continue to increase in 2010 as
the fees charged by programming networks increase, as new
fees for retransmission of broadcast networks are incurred
and as we provide additional channels and video on demand
programming options to our customers.
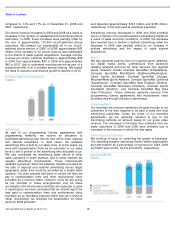
Technical labor expenses include the internal and external
labor to complete service call and installation activities in the
home, network operations, fulfillment and provisioning costs.
These expenses increased in 2009 and 2008 primarily due to
growth in the number of customers, which required additional
personnel to handle service calls and provide in-home
customer support, as well as activity associated with the
transition by broadcasters from
analog to digital transmission and our all digital conversion,
and, in 2008, due to the effects of cable system acquisitions.
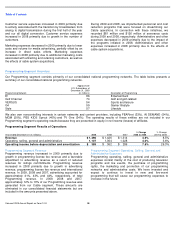
High-speed Internet expenses and phone expenses include
certain direct costs for providing these services but do not
fully reflect the amount of operating expenses that would be
necessary to provide these services on a stand-alone basis.
Other related costs associated with providing these services
are generally shared among all our cable services and are
not allocated to these items. The decreases in high-speed
Internet expenses in 2009 and 2008 and phone expenses in
2009 were primarily due to lower support service costs that
were the result of operating efficiencies. Phone expenses
increased in 2008 primarily due to an increase in the number
of customers, partially offset by operational efficiencies.
Other operating expenses include franchise fees, pole
rentals, plant maintenance, vehicle-related costs, expenses
related to our regional sports networks, advertising
representation and commission fees, and expenses
associated with our commercial services. These expenses
increased in 2009 and 2008 primarily due to the continued
expansion of commercial services, an increase in franchise
fees and, in 2008, the effects of cable system acquisitions
and the acquisitions in June 2007 of Comcast SportsNet Bay
Area and Comcast SportsNet New England.