Comcast 2009 Annual Report Download - page 30
Download and view the complete annual report
Please find page 30 of the 2009 Comcast annual report below. You can navigate through the pages in the report by either clicking on the pages listed below, or by using the keyword search tool below to find specific information within the annual report.-
 1
1 -
2
-
3
-
4
-
5
-
6
-
7
-
8
-
9
-
10
-
11
-
12
-
13
-
14
-
15
-
16
-
17
-
18
-
19
-
 20
20 -
 21
21 -
 22
22 -
 23
23 -
 24
24 -
 25
25 -
 26
26 -
 27
27 -
 28
28 -
 29
29 -
 30
30 -
 31
31 -
 32
32 -
 33
33 -
 34
34 -
 35
35 -
 36
36 -
 37
37 -
 38
38 -
 39
39 -
 40
40 -
41
-
42
-
43
-
44
-
45
-
46
-
47
-
48
-
49
-
50
-
51
-
52
-
53
-
54
-
55
-
56
-
57
-
58
-
59
-
60
-
61
-
62
-
63
-
64
-
65
-
66
-
67
-
68
-
69
-
70
-
71
-
72
-
73
-
74
-
75
-
76
-
77
-
78
-
79
-
80
-
81
-
82
-
83
-
84
-
85
-
86
-
87
-
88
-
89
-
90
-
91
-
92
-
93
-
94
-
95
-
96
-
97
-
98
-
99
-
100
-
101
-
102
-
103
-
104
-
105
-
106
-
107
-
108
-
109
-
110
-
111
-
112
-
113
-
114
-
115
-
116
-
117
-
118
-
119
-
120
-
121
-
122
-
123
-
124
-
125
-
126
-
127
-
128
-
129
-
130
-
131
-
132
-
133
-
134
-
135
-
136
-
137
-
138
-
139
-
140
-
141
-
142
-
143
-
144
-
145
-
146
-
147
-
148
-
149
-
150
-
151
-
152
-
153
-
154
-
155
-
156
-
157
-
158
-
159
-
160
-
161
-
162
-
163
-
164
-
165
-
166
-
167
-
168
-
169
-
170
-
171
-
172
-
173
-
174
-
175
-
176
-
177
-
178
-
179
-
180
-
181
-
182
-
183
-
184
-
185
-
186
-
187
-
188
-
189
-
190
-
191
-
192
-
193
-
194
-
195
-
196
-
197
-
198
-
199
-
200
-
201
-
202
-
203
-
204
-
205
-
206
-
207
-
208
-
209
-
210
-
211
-
212
-
213
-
214
-
215
-
216
-
217
-
218
-
219
-
220
-
221
-
222
-
223
-
224
-
225
-
226
-
227
-
228
-
229
-
230
-
231
 |
 |
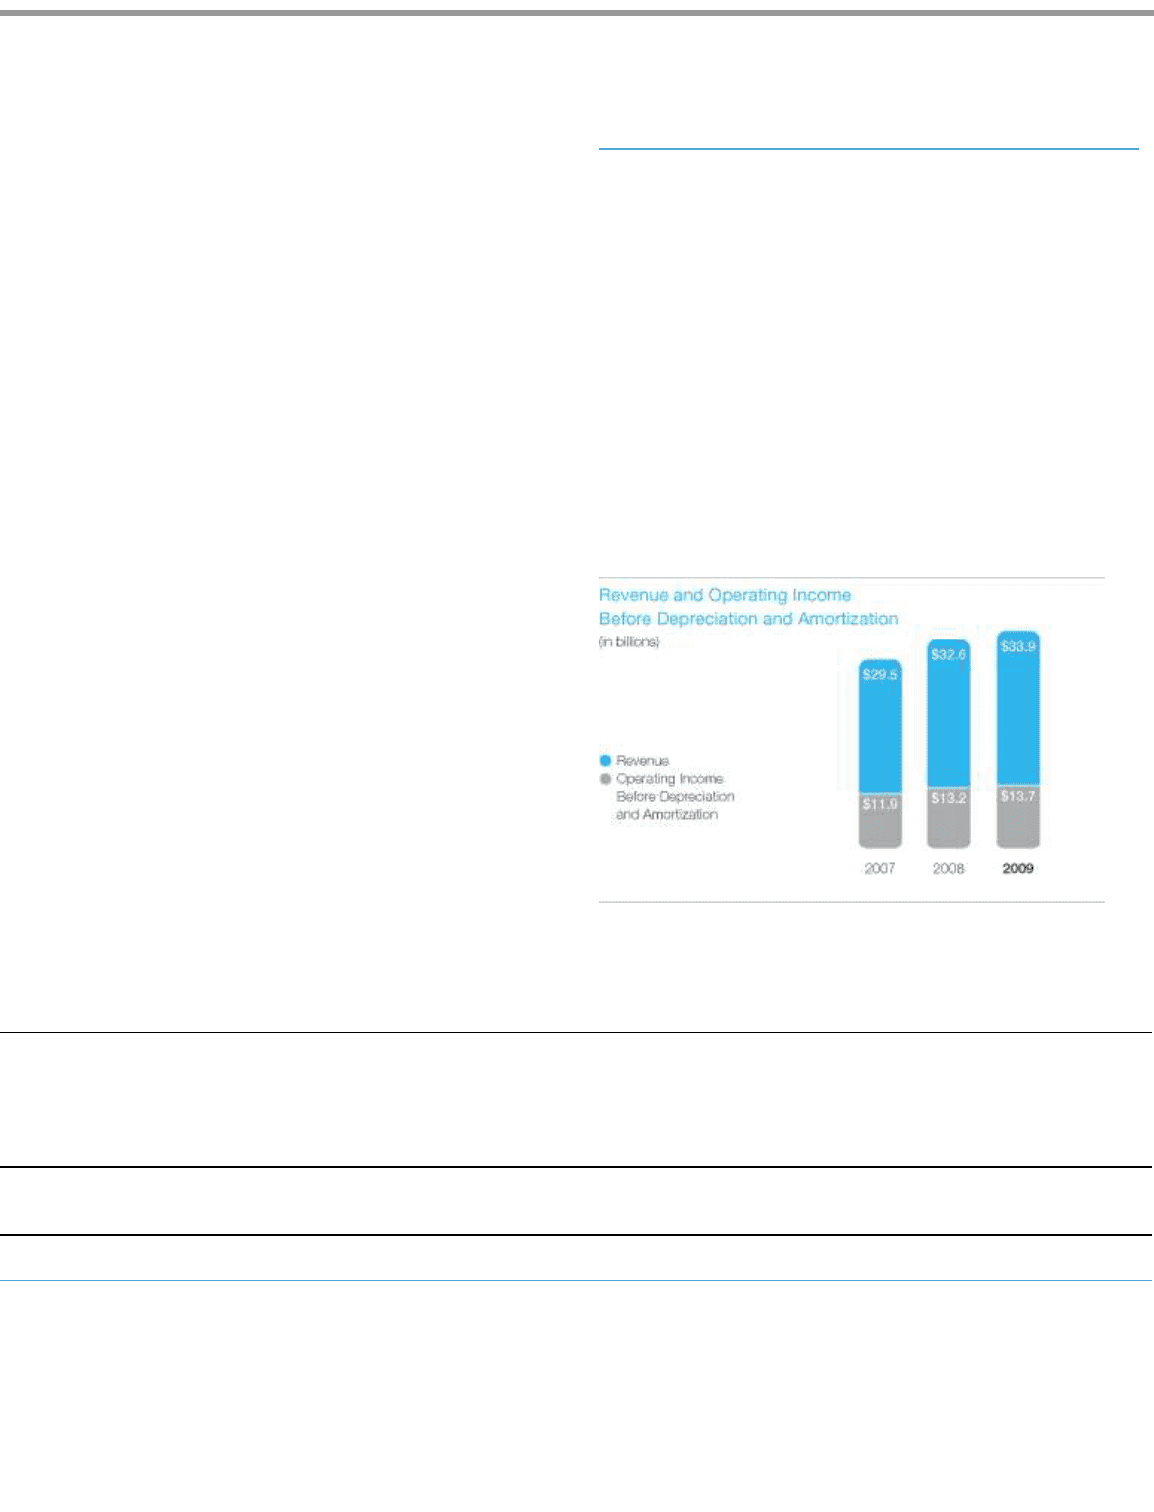
Table of Contents
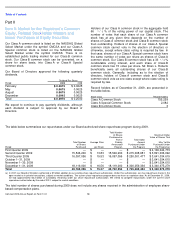
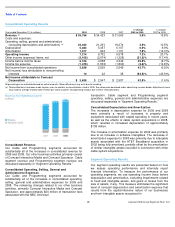
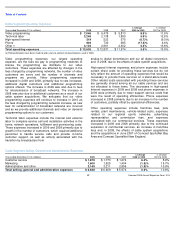
Cable Segment Results of Operations
(a) Reclassifications have been made to prior years to conform to classifications used in 2009.
Year ended December 31 (in millions)
2009
2008
2007
% Change
2008 to 2009
% Change
2007 to 2008
Video
$
19,377
$
19,162
$
17,939
1.1
%
6.8
%
High
-
speed Internet
7,757
7,225
6,402
7.4
%
12.9
%
Phone
3,262
2,649
1,766
23.1
%
50.0
%
Advertising
1,444
1,709
1,728
(15.5
)%
(1.1
)%
Other
1,069
954
808
12.1
%
18.1
%
Franchise fees
948
911
827
4.1
%
10.1
%
Revenue
33,857
32,610
29,470
3.8
%
10.7
%
Operating expenses
13,535
12,831
11,574
5.5
%
10.9
%
Selling, general and administrative expenses
6,628
6,609
5,974
0.3
%
10.6
%
Operating income before depreciation and
amortization
$
13,694
$
13,170
$
11,922
4.0
%
10.5
%
Comcast 2009 Annual Report on Form 10-K
24
business combinations. Additionally, it is unaffected by our
capital structure or investment activities. We use this
measure to evaluate our consolidated operating performance
and the operating performance of our operating segments
and to allocate resources and capital to our operating
segments. It is also a significant performance measure in our
annual incentive compensation programs. We believe that
this measure is useful to investors because it is one of the
bases for comparing our operating performance with that of
other companies in our industries, although our measure may
not be directly comparable to similar measures used by other
companies. Because we use this metric to measure our
segment profit or loss, we reconcile it to operating income,
the most directly comparable financial measure calculated
and presented in accordance with generally accepted
accounting principles in the United States (“GAAP”) in the
business segment footnote to our consolidated financial
statements (see Note 18 to our consolidated financial
statements). This measure should not be considered a
substitute for operating income (loss), net income (loss)
attributable to Comcast Corporation, net cash provided by
operating activities, or other measures of performance or
liquidity we have reported in accordance with GAAP.
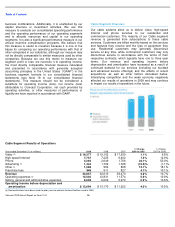
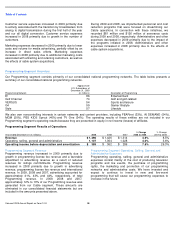
Cable Segment Overview
Our cable systems allow us to deliver video, high-speed
Internet and phone services to our residential and
commercial customers. The majority of our Cable segment
revenue is generated from subscriptions to these cable
services. Customers are billed monthly based on the services
and features they receive and the type of equipment they
use. Residential customers may generally discontinue
service at any time, while commercial customers may only
discontinue service in accordance with the terms of their
respective contracts, which typically have one to three year
terms. Our revenue and operating income before
depreciation and amortization have increased as a result of
continued demand for our services (including our bundled
and advanced service offerings) and the effects of recent
acquisitions, as well as other factors discussed below.
Intensifying competition and the weak economy negatively
affected our results of operations in 2009 and may continue
to impact our results of operations in the future.
(a)
(a)
(a)
(a)