Comcast 2009 Annual Report Download - page 34
Download and view the complete annual report
Please find page 34 of the 2009 Comcast annual report below. You can navigate through the pages in the report by either clicking on the pages listed below, or by using the keyword search tool below to find specific information within the annual report.-
 1
1 -
2
-
3
-
4
-
5
-
6
-
7
-
8
-
9
-
10
-
11
-
12
-
13
-
14
-
15
-
16
-
17
-
18
-
19
-
20
-
21
-
22
-
23
-
 24
24 -
 25
25 -
 26
26 -
 27
27 -
 28
28 -
 29
29 -
 30
30 -
 31
31 -
 32
32 -
 33
33 -
 34
34 -
 35
35 -
 36
36 -
 37
37 -
 38
38 -
 39
39 -
 40
40 -
 41
41 -
 42
42 -
 43
43 -
 44
44 -
45
-
46
-
47
-
48
-
49
-
50
-
51
-
52
-
53
-
54
-
55
-
56
-
57
-
58
-
59
-
60
-
61
-
62
-
63
-
64
-
65
-
66
-
67
-
68
-
69
-
70
-
71
-
72
-
73
-
74
-
75
-
76
-
77
-
78
-
79
-
80
-
81
-
82
-
83
-
84
-
85
-
86
-
87
-
88
-
89
-
90
-
91
-
92
-
93
-
94
-
95
-
96
-
97
-
98
-
99
-
100
-
101
-
102
-
103
-
104
-
105
-
106
-
107
-
108
-
109
-
110
-
111
-
112
-
113
-
114
-
115
-
116
-
117
-
118
-
119
-
120
-
121
-
122
-
123
-
124
-
125
-
126
-
127
-
128
-
129
-
130
-
131
-
132
-
133
-
134
-
135
-
136
-
137
-
138
-
139
-
140
-
141
-
142
-
143
-
144
-
145
-
146
-
147
-
148
-
149
-
150
-
151
-
152
-
153
-
154
-
155
-
156
-
157
-
158
-
159
-
160
-
161
-
162
-
163
-
164
-
165
-
166
-
167
-
168
-
169
-
170
-
171
-
172
-
173
-
174
-
175
-
176
-
177
-
178
-
179
-
180
-
181
-
182
-
183
-
184
-
185
-
186
-
187
-
188
-
189
-
190
-
191
-
192
-
193
-
194
-
195
-
196
-
197
-
198
-
199
-
200
-
201
-
202
-
203
-
204
-
205
-
206
-
207
-
208
-
209
-
210
-
211
-
212
-
213
-
214
-
215
-
216
-
217
-
218
-
219
-
220
-
221
-
222
-
223
-
224
-
225
-
226
-
227
-
228
-
229
-
230
-
231
 |
 |

Table of Contents
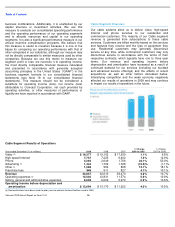
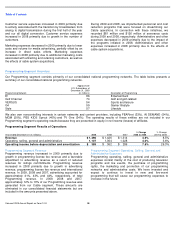
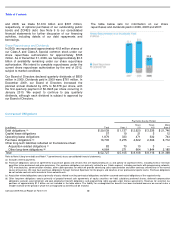
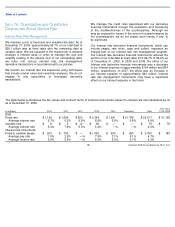
Programming Segment Overview
Our Programming segment consists primarily of our consolidated national programming networks. The table below presents a
summary of our consolidated national programming networks.
We also own noncontrolling interests in certain networks and content providers, including FEARnet (33%), iN DEMAND (54%),
MGM (20%), PBS KIDS Sprout (40%) and TV One (34%). The operating results of these entities are not included in our
Programming segment’s operating results because they are presented in equity in net income (losses) of affiliates.
Programming Segment Results of Operations
Programming Network
Approximate
U.S. Subscribers at
December 31, 2009
(in millions)
Description of Programming
E!
86
Entertainment
Golf Channel
74
Golf and golf
-
related
VERSUS
54
Sports and leisure
G4
59
Gamer lifestyle
Style
57
Lifestyle
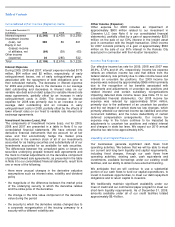
Year ended December 31 (in millions)
2009
2008
2007
% Change
2008 to 2009
% Change
2007 to 2008
Revenue
$
1,496
$
1,426
$
1,314
4.9
%
8.5
%
Operating, selling, general and administrative
1,107
1,064
1,028
4.0
%
3.6
%
Operating income before depreciation and amortization
$
389
$
362
$
286
7.5
%
26.3
%
Comcast 2009 Annual Report on Form 10-K
28
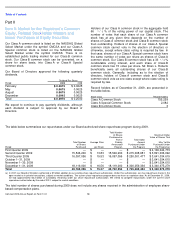
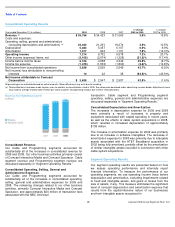
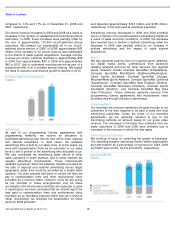
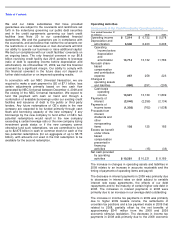
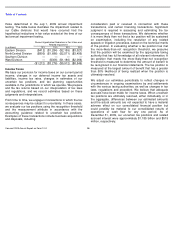
Customer service expenses increased in 2009 primarily due
to activity associated with the transition by broadcasters from
analog to digital transmission during the first half of the year
and our all digital conversion. Customer service expenses
increased in 2008 primarily due to growth in the number of
customers.
Marketing expenses decreased in 2009 primarily due to lower
costs and volume for media advertising, partially offset by an
increase in direct sales efforts. Marketing expenses
increased in 2008 primarily due to additional marketing costs
associated with attracting and retaining customers, as well as
the effects of cable system acquisitions.
During 2009 and 2008, we implemented personnel and cost
reduction programs that were focused on streamlining our
Cable operations. In connection with these initiatives, we
recorded $81 million and $126 million of severance costs
during 2009 and 2008, respectively. Administrative and other
expenses decreased in 2009 primarily due to the impact of
the programs initiated in 2008. Administrative and other
expenses increased in 2008 primarily due to the effects of
cable system acquisitions.
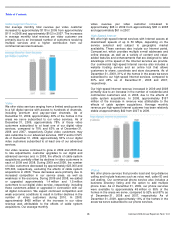
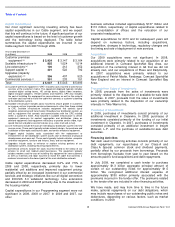
Programming Segment Revenue
Programming revenue increased in 2009 primarily due to
growth in programming license fee revenue and a favorable
adjustment to advertising revenue as a result of reduced
reserves for ratings commitments. Programming revenue
increased in 2008 primarily due to growth in advertising
revenue, programming license fee revenue and international
revenue. In 2009, 2008 and 2007, advertising accounted for
approximately 41%, 43% and 44%, respectively, of total
Programming revenue. In 2009, 2008 and 2007,
approximately 12% to 13% of our Programming revenue was
generated from our Cable segment. These amounts are
eliminated in our consolidated financial statements but are
included in the amounts presented above.
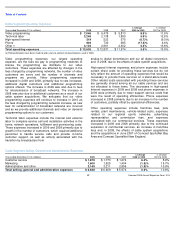
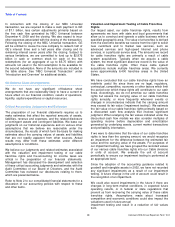
Programming Segment Operating, Selling, General and
Administrative Expenses
Programming operating, selling, general and administrative
expenses consist mainly of the cost of producing television
programs and live events, the purchase of programming
rights, the marketing and promotion of our programming
networks and administrative costs. We have invested and
expect to continue to invest in new and live-event
programming that will cause our programming expenses to
increase in the future.