Comcast 2009 Annual Report Download - page 65
Download and view the complete annual report
Please find page 65 of the 2009 Comcast annual report below. You can navigate through the pages in the report by either clicking on the pages listed below, or by using the keyword search tool below to find specific information within the annual report.-
 1
1 -
2
-
3
-
4
-
5
-
6
-
7
-
8
-
9
-
10
-
11
-
12
-
13
-
14
-
15
-
16
-
17
-
18
-
19
-
20
-
21
-
22
-
23
-
24
-
25
-
26
-
27
-
28
-
29
-
30
-
31
-
32
-
33
-
34
-
35
-
36
-
37
-
38
-
39
-
40
-
41
-
42
-
43
-
44
-
45
-
46
-
47
-
48
-
49
-
50
-
51
-
52
-
53
-
54
-
 55
55 -
 56
56 -
 57
57 -
 58
58 -
 59
59 -
 60
60 -
 61
61 -
 62
62 -
 63
63 -
 64
64 -
 65
65 -
 66
66 -
 67
67 -
 68
68 -
 69
69 -
 70
70 -
 71
71 -
 72
72 -
 73
73 -
 74
74 -
 75
75 -
76
-
77
-
78
-
79
-
80
-
81
-
82
-
83
-
84
-
85
-
86
-
87
-
88
-
89
-
90
-
91
-
92
-
93
-
94
-
95
-
96
-
97
-
98
-
99
-
100
-
101
-
102
-
103
-
104
-
105
-
106
-
107
-
108
-
109
-
110
-
111
-
112
-
113
-
114
-
115
-
116
-
117
-
118
-
119
-
120
-
121
-
122
-
123
-
124
-
125
-
126
-
127
-
128
-
129
-
130
-
131
-
132
-
133
-
134
-
135
-
136
-
137
-
138
-
139
-
140
-
141
-
142
-
143
-
144
-
145
-
146
-
147
-
148
-
149
-
150
-
151
-
152
-
153
-
154
-
155
-
156
-
157
-
158
-
159
-
160
-
161
-
162
-
163
-
164
-
165
-
166
-
167
-
168
-
169
-
170
-
171
-
172
-
173
-
174
-
175
-
176
-
177
-
178
-
179
-
180
-
181
-
182
-
183
-
184
-
185
-
186
-
187
-
188
-
189
-
190
-
191
-
192
-
193
-
194
-
195
-
196
-
197
-
198
-
199
-
200
-
201
-
202
-
203
-
204
-
205
-
206
-
207
-
208
-
209
-
210
-
211
-
212
-
213
-
214
-
215
-
216
-
217
-
218
-
219
-
220
-
221
-
222
-
223
-
224
-
225
-
226
-
227
-
228
-
229
-
230
-
231
 |
 |

Table of Contents
Comcast 2009 Annual Report on Form 10-K
56
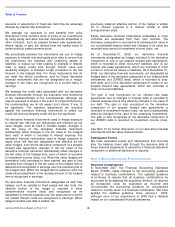
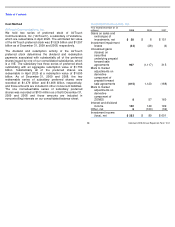
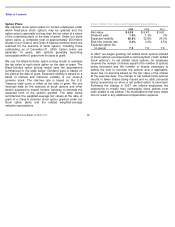
As of December 31, 2009 and 2008, our debt had an
estimated fair value of $31.247 billion and $32.001 billion,
respectively. The estimated fair value of our publicly traded
debt is based on quoted market values on an active market
for the debt. To estimate the fair value of debt issuances for
which there are no quoted market prices, we use interest
rates available to us for debt issuances with similar terms and
remaining maturities.
Some of our loan agreements require that we maintain
certain financial ratios based on our debt and our operating
income before depreciation and amortization. We were in
compliance with all financial covenants for all periods
presented. See Note 20 for a discussion of our subsidiary
guarantee structures.
As of December 31, 2009 and 2008, accrued interest was
$497 million and $520 million, respectively.
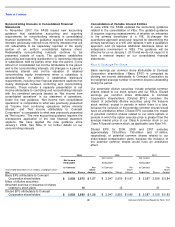
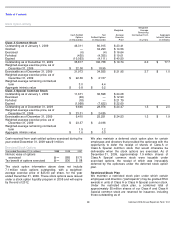
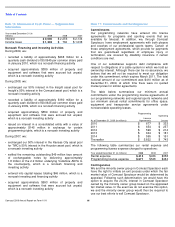
Debt Maturities
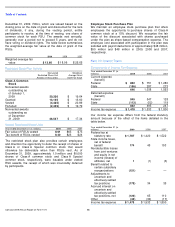
Debt Borrowings
We used the net proceeds of these borrowings, together with
cash on hand, for the repurchase of debt securities prior to
their scheduled maturities, the repayment of outstanding
borrowings under our revolving credit facility, the repayment
of debt at its maturity, as well as for working capital and
general corporate purposes.
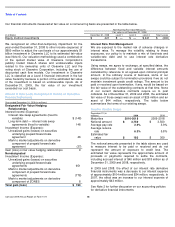
As of December 31, 2009 (in millions)
2010
$
1,156
2011
$
1,809
2012
$
832
2013
$
2,450
2014
$
1,091
Thereafter
$
21,758
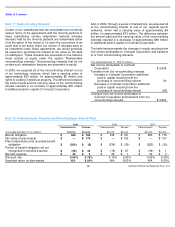
Year ended December 31, 2009 (in millions)
5.70% notes due 2019
$
700
6.55% notes due 2039
800
Other
64
Total
$
1,564
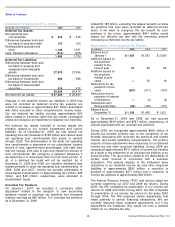
Debt Repayments
In July 2009, we completed a cash tender to purchase $1.3
billion aggregate principal amount of certain of our
outstanding notes for approximately $1.5 billion. These notes
consisted of approximately $621 million principal amount of
our 8.375% notes due 2013, $367 million principal amount of
our 7.125% notes due 2013 and $312 million principal
amount of our 7.875% senior debentures due 2013. In 2009,
we recognized approximately $180 million of interest
expense primarily associated with the premiums incurred in
this cash tender.
Debt Instruments
Commercial Paper Program
Our commercial paper program provides a lower cost
borrowing source of liquidity to fund our short-term working
capital requirements. The program allows for a maximum of
$2.25 billion of commercial paper to be issued at any one
time. Our revolving bank credit facility supports this program.
Revolving Bank Credit Facility
As of December 31, 2009, we had a $6.8 billion revolving
credit facility due January 2013 (the “credit facility”) with a
syndicate of banks. The base rate, chosen at our option, is
either the London Interbank Offered Rate (“LIBOR”) or the
greater of the prime rate or the Federal Funds rate plus 0.5%.
The borrowing margin is based on our senior unsecured debt
ratings. As of December 31, 2009, the interest rate for
borrowings under the credit facility was LIBOR plus 0.35%.
Lines and Letters of Credit
As of December 31, 2009, we and certain of our subsidiaries
had unused lines of credit totaling $6.411 billion under
various credit facilities and unused irrevocable standby letters
of credit totaling $416 million to cover potential fundings
under various agreements.
ZONES
At maturity, holders of our 2.0% Exchangeable Subordinated
Debentures due 2029 (“ZONES”) are entitled to receive in
cash an amount equal to the higher of the principal amount of
the outstanding ZONES of $282 million or the market value of
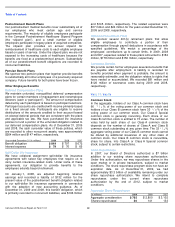
Year ended December 31, 2009 (in millions)
Revolving bank credit facility due 2013
$
1,000
Floating rate notes due 2009
1,241
6.875% notes due 2009
750
8.375% notes due 2013
676
7.125% notes due 2013
367
7.875% senior debentures due 2013
312
ZONES due 2029
262
Other
130
Total
$
4,738